6 Menu
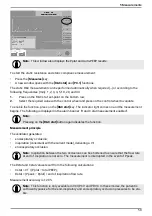
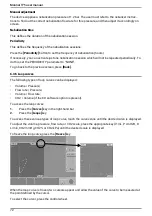
Turn the control wheel to move the cursor.
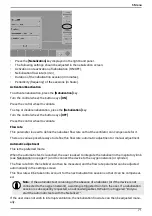
The values measured on each curve are displayed under the frozen curve.
The symbol Δ indicates the volume, pressure, flow rate, or CO2 interval between the two cursors.
To exit from frozen curve mode, press
[Back]
.
6.3.6 Trends
This function allows the user to monitor the development of the following ventilation settings over a
maximum 80 hours:
RR
VTi
Vte
MVe
Pplat
Ppeak
Pmean
PEEP
Ti/Ttot
%Leak
Auto-PEEP
spont. MVe
spont. RR
spont.%
peak ins
peak exp
P0.1
Rstat
Cstat
Rdyn
Cdyn
NIF
WOB
leak
I:E
FiO2
etCO2
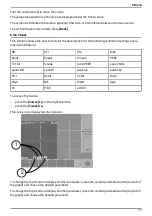
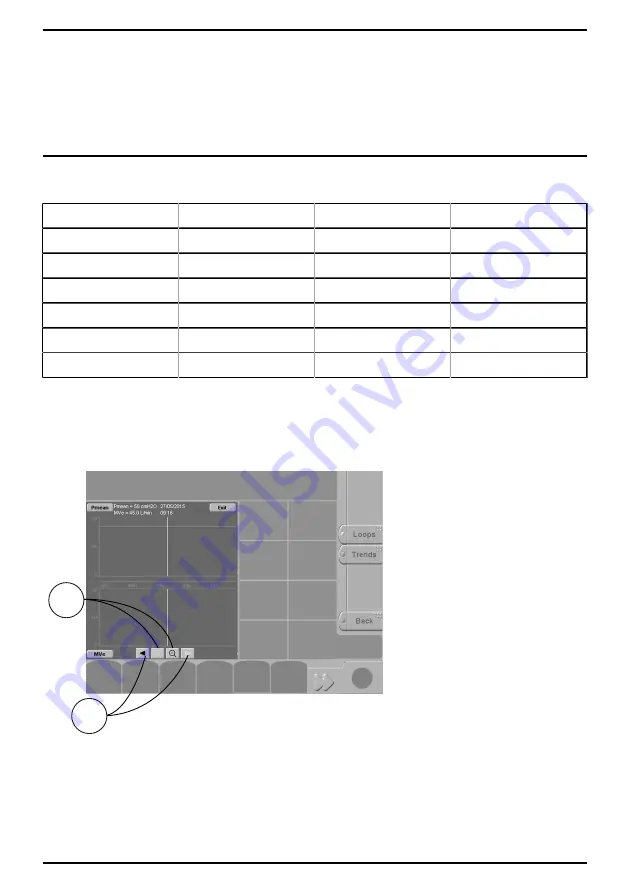
To access the trends:
•
press the
[Curves]
key in the right-hand bar.
•
press the
[Trends]
key.
This screen can display two trend curves.
2
1
To change the top trend and display another parameter, press the current parameter button (top-left of
the graph) and choose the desired parameter.
To change the top trend and display another parameter, press the current parameter button (top-left of
the graph) and choose the desired parameter.
73
Summary of Contents for MONNAL T75
Page 2: ......

