AirTest PT9250 & CO
2
Application Guide
3 of
12
The Display
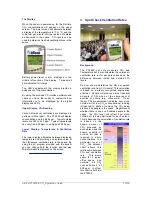
When the sensor is powered up for the first time
CO
2
concentrations will appear on the upper
screen. The lower screen will alternate between
a display of the temperature in ºF or ºC, and the
cubic feet per minute (cfm) per person of outside
air delivered to the space. CO
2
levels can be
used to determine fresh air ventilation rates in the
space.
Battery power level is also displayed in the
middle left portion of the display. Three small
bars indicate a full charge.
The LED’s underneath the display provide a
quick check of the concentration.
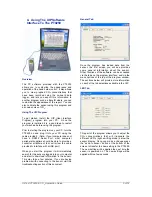
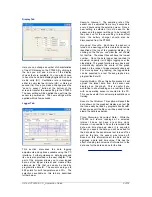
By using the provided PC interface software and
cable you have the ability to customize how
information is to be displayed by the digital
display and LED’s.
Upper Display: CO
2
Reading
Carbon dioxide concentrations are displayed in
parts per million (ppm). The PT 9250 will display
concentrations up to 9,999 ppm . Typical outside
levels are 380 to 450 ppm. Typical inside levels
can vary from 400 ppm to as high as 3,000 ppm.
Lower Display: Temperature & Ventilation
Rate
The lower display alternates between displaying
temperature and providing a calculated value of
the cfm/person ventilation rate in the space. By
using the pC program provided with the sensor
you can change both the location and the way
this information is displayed on the screen.
3. Spot Check Ventilation Rates
Background
The PT9250 not only measures CO
2
and
Temperature but it also calculates the outside air
ventilation rate in cfm per person based on the
difference between inside and outside CO
2
levels.
So how can we determine the cfm per person
ventilation rate from CO
2
levels? This calculation
is based on a widely recognized engineering
principal. People will produce almost identical
amounts of CO
2
when at the same level of
exertion or activity (e.g. office work). So an
indoor CO
2
measurement indicates how much
outside air (at low CO
2
concentrations) is being
introduced to dilute or remove the CO
2
being
produced by people in the space. Regardless of
whether there is one or a hundred people in the
space, the CO
2
level will reflect how much
outside air is being delivered for each person.
This is because the calculation of ventilation rate
is based on the
known amount of
CO
2
produced by
each person and the
known quantity of
outside air that is
required to dilute
concentrations to a
particular level of
CO
2
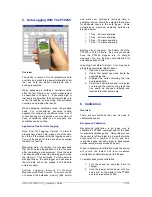
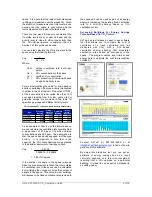
. The adjacent
chart shows this
relationship between
CO
2
and ventilation
rate. This would
apply for a typical
office space and
outside
air CO
2
concentrations of
400 ppm. In effect,
this chart is built into
the PT9250.


