AirTest PT9250 & CO
2
Application Guide
6 of
12
Display Tab
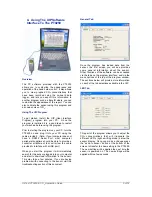
Here you can change a number of characteristics
of the LCD display on the PT9250. By clicking in
the box you will see a menu of the display
choices that are available. You can also choose
to have the hand held display English/US units or
metric units (SI). Ventilation rate is displayed
either in cubic feet per minute (cfm) or liters per
second( l/s). Once you make a change press the
“send to sensor” button at the bottom of the
screen to transfer the new setting to the PT9250.
The new setting will be applied the next time the
sensor is powered on. The new settings will be
applied within a few seconds.
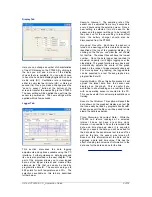
Logger Tab
This section discusses the data logging
adjustments and options available using the PC
interface. Further guidance on data logging and
its use is also provided in the next chapter. This
part of the program allows you to view logged
data, set the logger interval, and create a time
stamped text file that can easily be read by
programs like Excel®. The sensor can log up to
895 points for both temperature and CO
2
. The
selections available on this tab are described
further below.
Sample Interval:
The sampling rate of the
sensor can be adjusted from every 6 seconds to
every 4 hours using the selection menu. Once a
new setting is selected it must be sent to the
sensor and the sensor will have to be turned off
then back on for the new setting to take effect
Note: the battery charger should also be
disconnected from the PT9250.
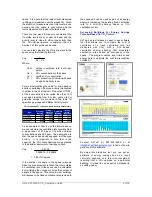
Graphed Results:
Each time the sensor is
turned on a new logger file is created and can be
identified at the top of the graphical display. By
clicking on the file you can view the set of data
for that file. The oldest files will have the lowest
number. Once the data logger has reached its
maximum capacity it will begin logging over the
oldest data. The graph function is very basic and
automatically adjusts the scale of the graph
based on the range of measurements observed.
For more options in graphing, the logged data
can be exported to a text file and graphed in a
program like Excel®.
Update Button:
When this button pressed it will
upload the latest data from the sensor and
display it on the graph. This is useful if you
would like to show readings on a real time basis
with an operating sensor connected to the PC.
This can be useful for customer presentations or
training.
Save As Text Button:
This option will export the
data shown on the graphical display as a text file
that can easily be read by programs like Excel®.
When you export the file you will be asked to time
stamp the data (see below).
Time Stamping Exported Data:
While the
PT9250 can record readings at a selected
interval it does not have a real time clock.
However it is possible to have the recorded data
date and time stamped when it is exported.
When you export the data you will be asked for
the date when the sensor was last turned off as
well as the time the sensor was turned off.
Based on this information all the data will be
assigned a date and time value. This has the
effect of adding two columns of information to the
data, one for the date and one for the time.


