Ethernet Administration
64
Single Counter
Graph
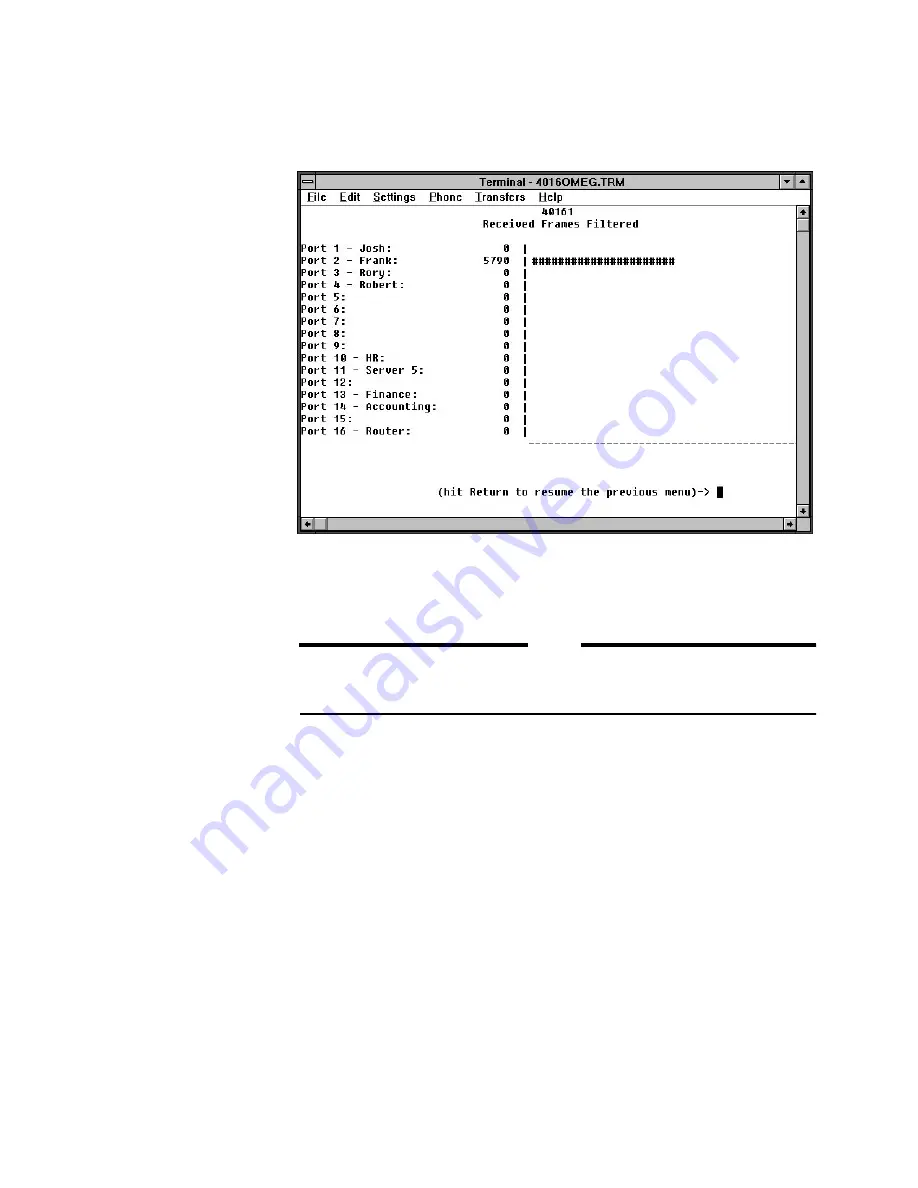
If you select one of the individual Statistics Database counters from the
Frame statistics
submenu (options A through K), the following display
appears:
The selected statistics counter (Received Frames Filtered in this example) is
graphed on a port-by-port basis. Each port’s counter value is shown to the left
of the graph, and the graph itself provides a visual comparison of each port.
NOTE
This display will be automatically updated if the type of terminal has been
configured. The counter will not increase is ANSI is not selected. Rather they
will be updated each time you enter the statistics screen.