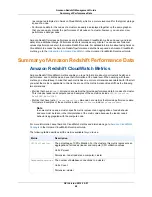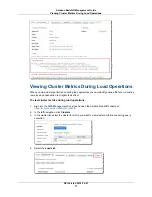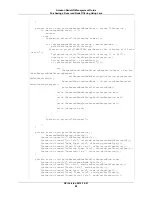
The following example shows the
NetworkReceiveThroughput
for a cluster with two nodes. It shows
a line for the leader and two compute nodes. Note that the leader node metrics is flat and is not of interest
since data is only loaded on the compute nodes. The example shows that one long query ran in the time
period shown. On the Queries graph the cursor is positioned over the long running query and the Query
ID is displayed on the right. You could then click the Query ID to find out more about the query running.
The
NetworkReceiveThroughput
value is displayed during the query execution.
Viewing Cluster Metrics During Query Execution
You can view cluster metrics during query execution to help identify poorly performing queries, look for
bottleneck queries, and determine if you need to resize your cluster for your workload.
To view cluster metrics during query execution
1.
Sign into the AWS Management Console and open the Amazon Redshift console at
https://console.aws.amazon.com/redshift
.
2.
In the left navigation, click Clusters.
3.
In the cluster list, select the cluster for which you want to view cluster performance during query
execution.
API Version 2012-12-01
74
Amazon Redshift Management Guide
Viewing Cluster Metrics During Query Execution


