Analysis and reporting
User manual
Page 30 of 68
© Amberg Technologies, 2018
4.1.3 Analysis settings
The
Analysis settings dialog
can be opened by clicking on the
Settings
button in the toolbar
or from the context menu. Analysis settings are saved for each analysis separately. To preview
your settings without leaving the settings dialog, use the
Apply
button at the bottom right.
Some settings offer suitable
color options
to change the display style. Use the color picker
to select text, fill and stroke color.
4.1.3.1 General settings
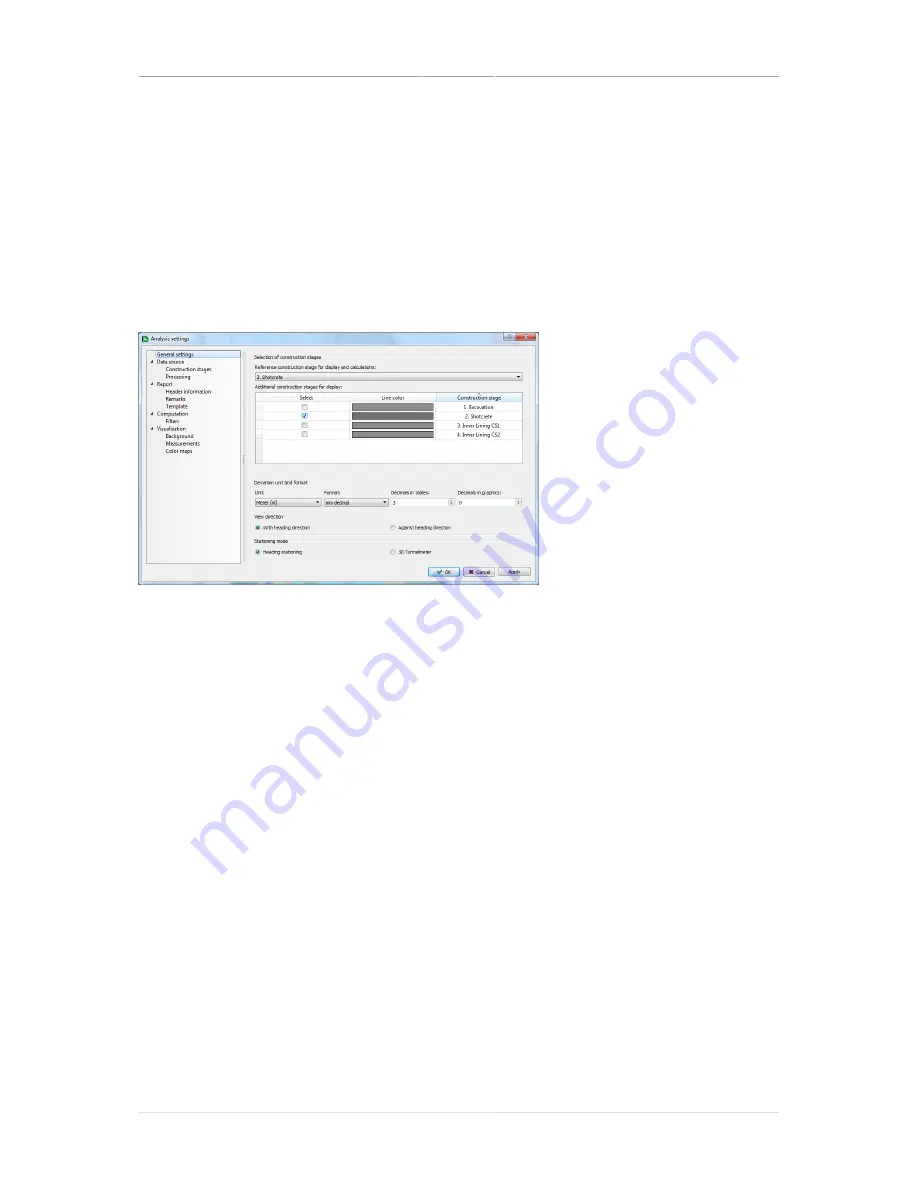
In the general settings page, the fundamental settings of the analysis are listed.
Figure 13. Settings dialog, General settings
Selection of construction
stages
The design data of the selected
Reference construction
stage
is used for all computations in this analysis. Option-
ally, theoretical profiles of
Additional construction stages
can be displayed. Select them in the list and change their
line color if desired.
Deviation unit and format
The calculated
deviation values
between the measured
profile and the design data are displayed as selected. Note
that you can have different decimal settings for tabular and
graphical reports.
View direction
Set the view direction for this analysis.
Stationing mode
Set the stationing mode for this analysis.
4.1.3.2 Data source - Construction stages
In the data source settings page, you can set the content of the analysis.
Summary of Contents for Tunnel 2.0 - Tunnelscan
Page 2: ......
Page 6: ...Page 6 of 68 ...
Page 10: ...Page 10 of 68 ...
Page 12: ...Page 12 of 68 ...
Page 26: ...Page 26 of 68 ...
Page 62: ...Page 62 of 68 ...
Page 66: ...Page 66 of 68 ...
Page 67: ......


