User manual
Analysis and reporting
© Amberg Technologies, 2018
Page 41 of 68
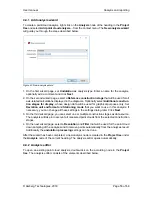
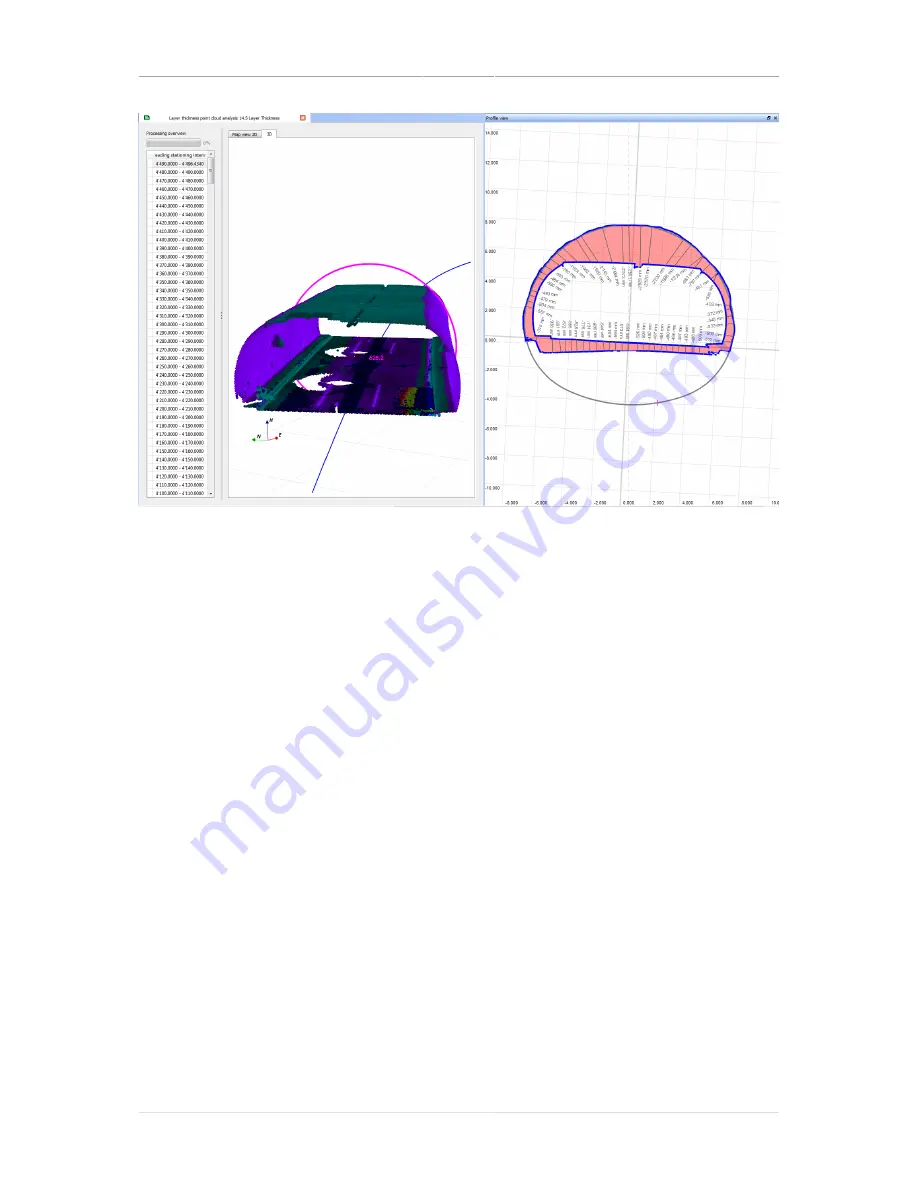
Figure 26. Analysis editor Layer thickness
4.2.2.1 Processing overview
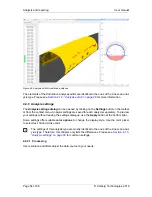
At the left part of the editor window, a heading sections interval list with sections in 10 meter
(around 30 feet) steps of the
Comparison construction stage
and of the selected
Original
construction stages
are listed. On the left side the status of calculation is visible in different
colours. (grey measurements available, red not processed, yellow in progress and green for
processed sections). The processing overview process bar displays the progress of the pro-
cessing during calculation time.
4.2.2.2 Processing
Multiple ore single sections can be selected by mouse click in the heading sections interval list.
Right click in the selected sections displays the processing context menu. Following options
are available.
Process all or selected
Process all or selected sections with the point clouds to the
theoretical 3D model of the tunnel.
Invalidate all or selected
Invalidates/delete the processing data of existing calcula-
tion results in the section.
Cancel
Stops the processing
Zoom to selection
Zooms to the selected section in the map view
4.2.2.3 Point cloud view
Analysis graphics are displayed in multiple tabs. Click on the tab name to activate a certain tab.
Summary of Contents for Tunnel 2.0 - Tunnelscan
Page 2: ......
Page 6: ...Page 6 of 68 ...
Page 10: ...Page 10 of 68 ...
Page 12: ...Page 12 of 68 ...
Page 26: ...Page 26 of 68 ...
Page 62: ...Page 62 of 68 ...
Page 66: ...Page 66 of 68 ...
Page 67: ......


