User manual
Analysis and reporting
© Amberg Technologies, 2018
Page 43 of 68
Some settings offer suitable
color options
to change the display style. Use the color picker
to select text, fill and stroke color.
The settings of this analysis type are mostly identical to the ones of the Line scan anal-
ysis type. Therefore, this chapter only lists the differences. Please see
Section 4.1.3,
“
Analysis settings
” on page 30
for common settings.
4.2.3.1 Data source - Construction stages
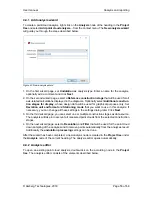
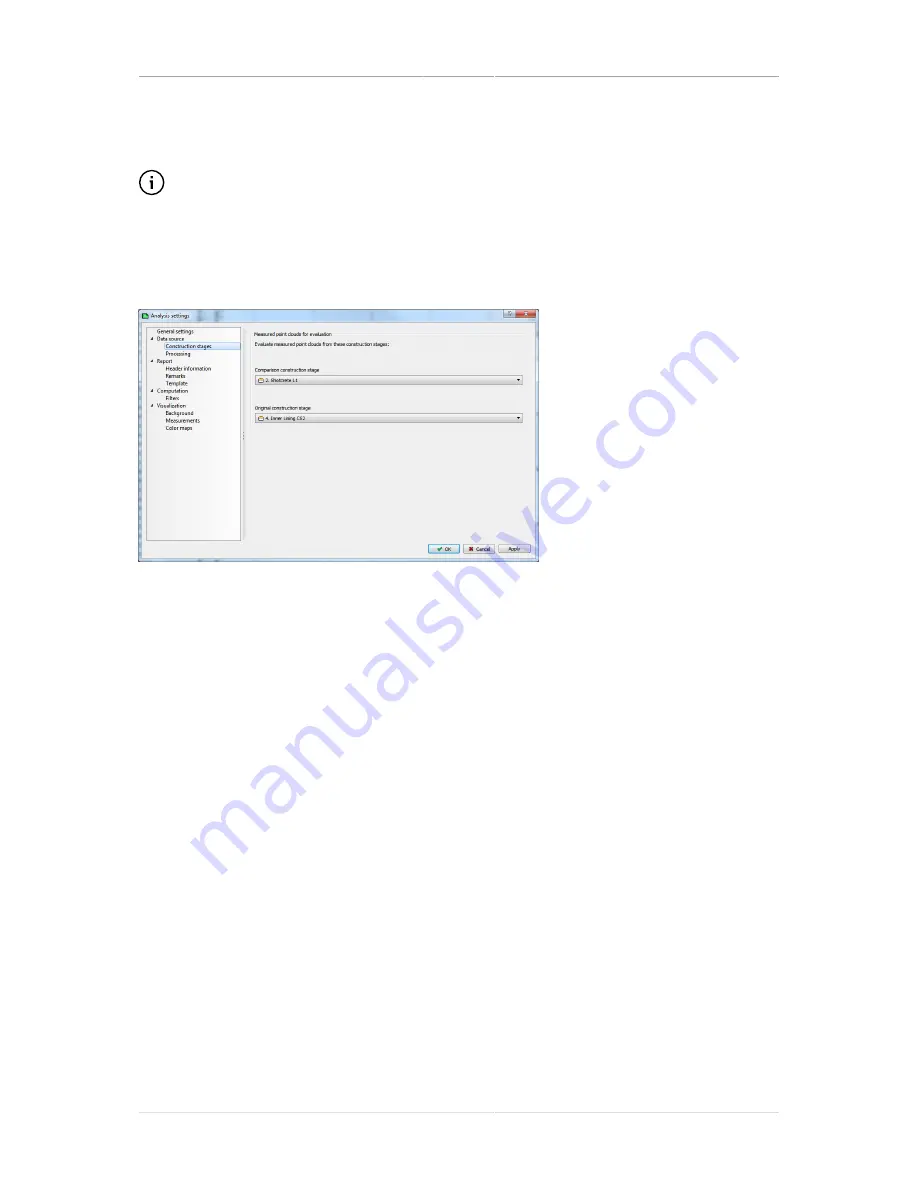
In the data source settings page, you can set the content of the analysis.
Figure 27. Settings dialog, Construction stages
Measured point clouds for
evaluation
Two different construction stages need to be selected:
■
Comparison construction stage
: Data source of the
point cloud that are compared against the original state.
■
Original construction stage
: Data source of the point
cloud that are used as representation of the original state.
4.2.4 Reporting
Convert the enhanced measured point cloud data and the derived computations of the analy-
sis into reports. Basically, two types of reports are available:
Tabular reports
and
Graphical
reports
. Select the report type that you want to include in your report.
4.2.4.1 Tabular reports
A tabular report of the analysed point cloud can be generated using the
Tabular report
button in
the toolbar or from the context menu. A stationing range or the block definition of the reference
construction stage can be used to present the reported values in an optimal way. The following
reports are available:
Layer thickness volume
Generates a tabular report containing the measured, refer-
ence, overprofile and underprofile area as well as the calcu-
lated volumes of the analysed point cloud.
Summary of Contents for Tunnel 2.0 - Tunnelscan
Page 2: ......
Page 6: ...Page 6 of 68 ...
Page 10: ...Page 10 of 68 ...
Page 12: ...Page 12 of 68 ...
Page 26: ...Page 26 of 68 ...
Page 62: ...Page 62 of 68 ...
Page 66: ...Page 66 of 68 ...
Page 67: ......


