User Guide
3 - 14
Signal Processor
LMG MkII
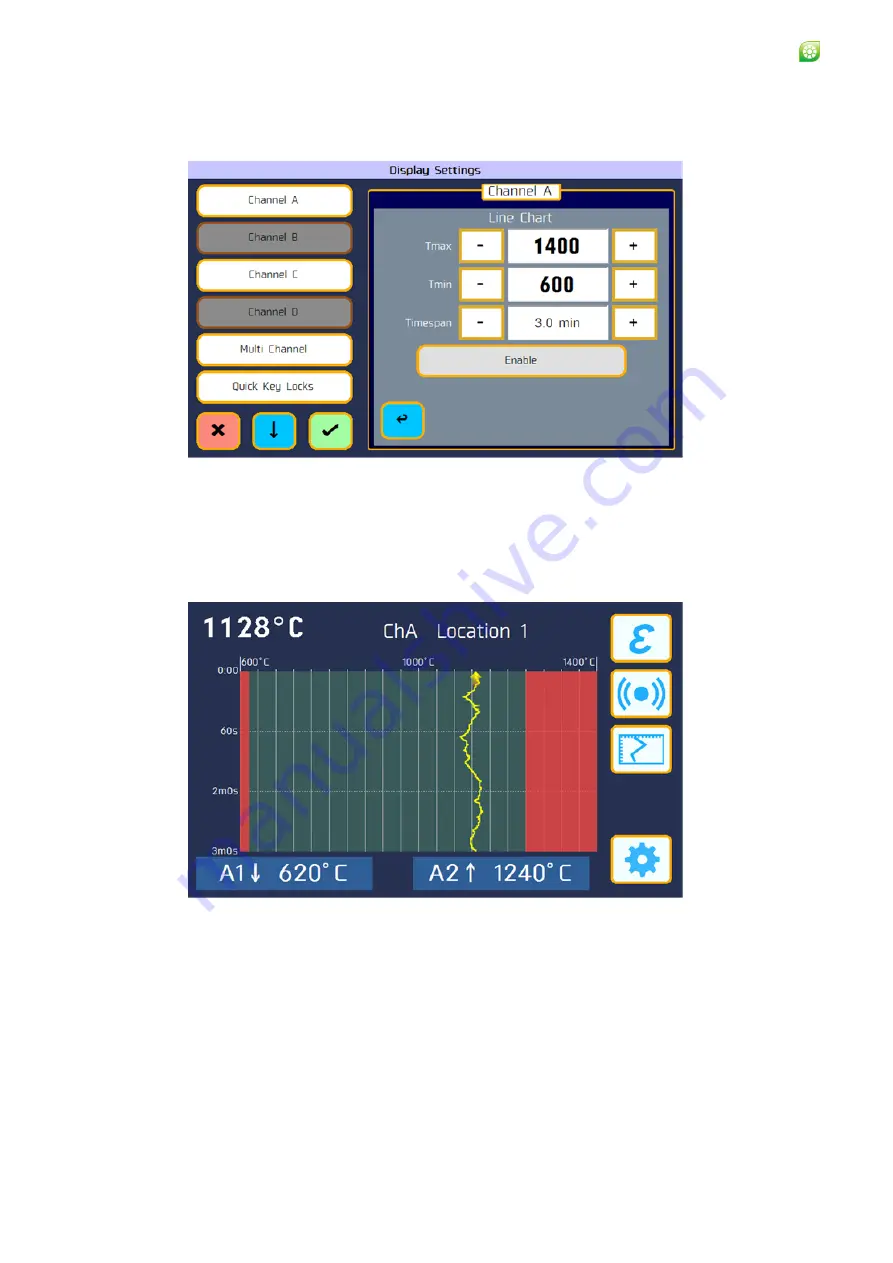
3.11.4 Line Chart Configuration
A typical Line Chart Configuration menu is shown in Fig. 3-19.
Fig. 3-19 Line Chart Configuration menu
This menu can be used to adjust the scale of the line chart view.
Use
Tmin
and
Tmax
to adjust the temperature range shown by the chart.
Adjust the
Timespan
to set the vertical scale.
Pressing the
Enable
button makes this type of view the active display upon
exiting the menu.
Fig. 3-20 Typical Line Chart display
The line chart shows a historic profile of the temperature over the selected
timespan. The minimum and maximin scaling, as well as the time span can
be set from the configuration menu. Red areas on the chart indicate the
regions where alarms will be active.
This screen also shows the current thermometer reading at the top left of the
screen, as well as the alarm levels at the bottom. In an alarm condition, the
triggered alarm will flash red.
You can drag vertically on the chart to temporarily alter the visible time span
shorter or longer. The timespan will return to the default after 5 seconds of
not being touched. A maximum of 4.5 hours is recorded by the LMG MkII.
Summary of Contents for LMG MkII
Page 6: ...INTRODUCTION 1 ...
Page 10: ...INSTALLING THE PROCESSOR 2 ...
Page 14: ...User Guide 2 4 Signal Processor LMG MkII Fig 2 4 LMG MkII Electrical System Overview ...
Page 22: ...3 USING THE PROCESSOR ...
Page 44: ...TIME FUNCTION PROCESSING 4 ...
Page 50: ...SERIAL COMMUNICATIONS 5 ...
Page 62: ...Signal Processor LMG MkII Blank ...
Page 63: ...EXTERNAL I O MATHS FUNCTIONS 6 ...
Page 64: ...Signal Processor LMG MkII Screws A Fig 6 1 Location of screws on back panel Screws A ...
Page 88: ...MAINTENANCE 7 ...
Page 92: ...User Guide 7 4 Signal Processor LMG MkII Fig 7 3 USB Export Data option ...