Rev 05 Jun 2013 16:37 | Page 16
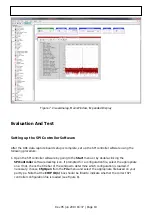
Figure 14. Graph
Window of VisualAnalog
Repeat this procedure for Channel B, Channel C, and Channel D.
2.
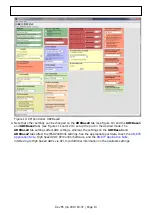
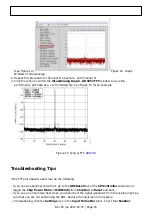
Click the disk icon within the VisualAnalog Graph - AD9253 FFT window to save the
3.
performance plot data as a .csv formatted file. See Figure 15 for an example.
Troubleshooting Tips
If the FFT plot appears abnormal, do the following:
If you see an abnormal noise floor, go to the ADCBase0 tab of the SPIController window and
●
toggle the Chip Power Mode in MODES(8) from Chip Run to Reset and back.
If you see a normal noise floor when you disconnect the signal generator from the analog input, be
●
sure that you are not overdriving the ADC. Reduce the input level if necessary.
In VisualAnalog, click the Settings icon in the Input Formatter block. Check that Number
●

