Preliminary Technical Data
AD9779
Rev. PrD | Page 25 of 34
Interpolation Filter Architecture
The AD9779 can provide up to 8
×
interpolation or disable the
interpolation filters entirely. The coefficients of the low pass filters
and the inverse sinc filter are given in
Table 5
,
Table 6
,
Table 7
, and
Table 8
. Spectral plots for the filter responses are given in Figure 3,
Figure 4, and Figure 5.
With the interpolation filter and modulator combined, the
incoming signal can be placed anywhere within the Nyquist region
of the DAC output sample rate. Where the input signal is complex,
this architecture allows modulation of the input signal to positive
or negative Nyquist regions (refer to Table 13).
The Nyquist regions up to 4
×
the input data rate can be seen in
Figure 39.
DC
1
×
4
×
3
×
2
×
-2
×
-3
×
-4
×
-1
×
1 2 3 4
-1
-2
5
7 8
6
-3
-4
-5
-6
-7
-8
Figure 39. Nyquist Zones
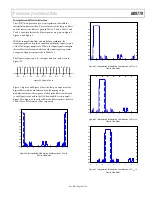
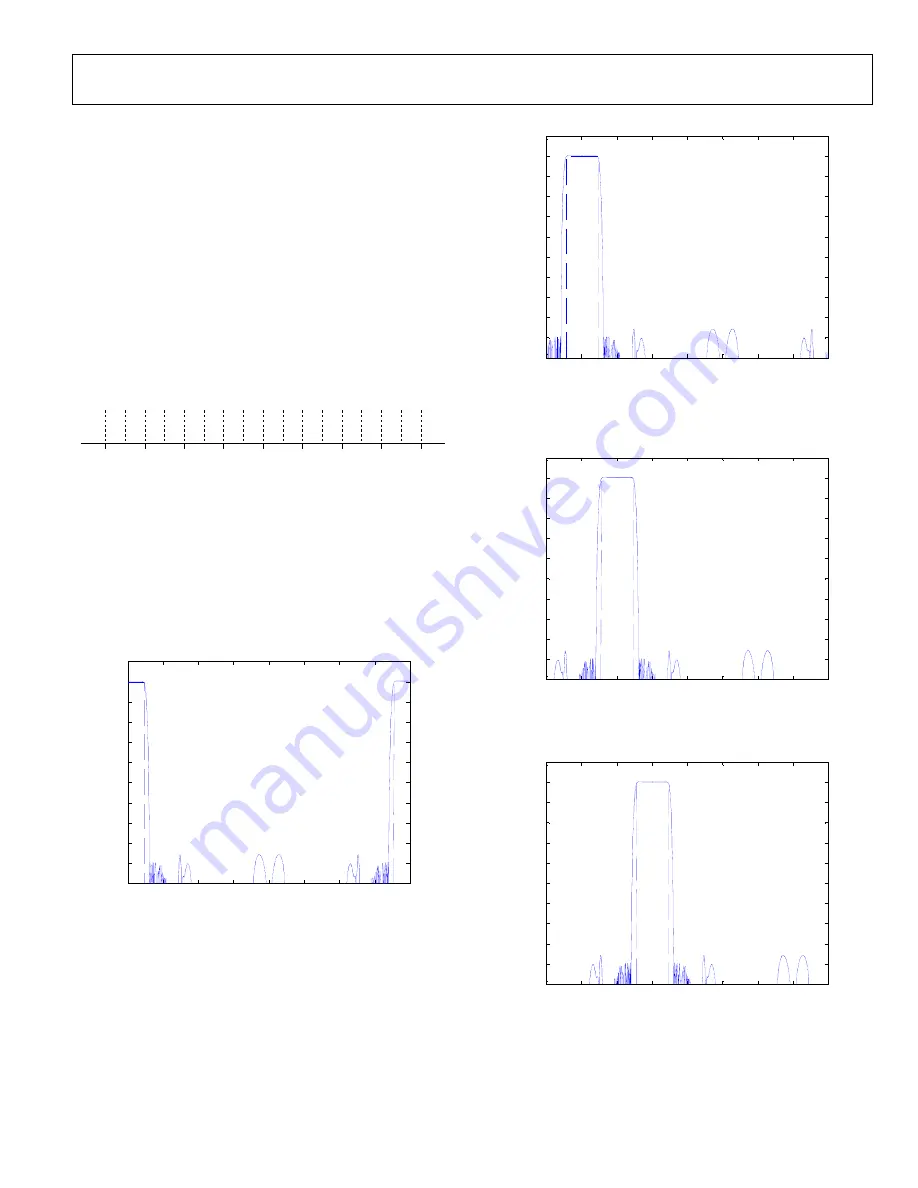
Figure 3, Figure 4 and Figure 5 show the low pass response of the
digital filters with no modulation used. By turning on the
modulation feature, the response of the digital filters can be tuned
to any Nyquist zone within the DAC bandwidth. As an example,
Figure 40 to Figure 46 show the odd mode filter responses (refer to
Table 13 for odd/even mode filter responses).
-4
-3
-2
-1
0
1
2
3
4
-100
-90
-80
-70
-60
-50
-40
-30
-20
-10
0
10
Figure 40. Interpolation/Modulation Combination of -4f
DAC
/8
Filter in Odd Mode
-4
-3
-2
-1
0
1
2
3
4
-100
-90
-80
-70
-60
-50
-40
-30
-20
-10
0
10
Figure 41. Interpolation/Modulation Combination of -3f
DAC
/8
Filter in Odd Mode
-4
-3
-2
-1
0
1
2
3
4
-100
-90
-80
-70
-60
-50
-40
-30
-20
-10
0
10
Figure 42. Interpolation/Modulation Combination of -2f
DAC
/8
Filter in Odd Mode
-4
-3
-2
-1
0
1
2
3
4
-100
-90
-80
-70
-60
-50
-40
-30
-20
-10
0
10
Figure 43. Interpolation/Modulation Combination of -1f
DAC
/8
Filter in Odd Mode


