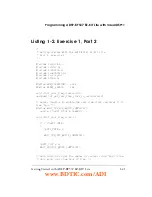
Exercise 1, Part 2: Analyzing Performance and Memory
Hierarchy Impact
1-12
Getting Started with ADSP-BF537 EZ-KIT Lite
Select the configuration for the project by choosing the
Release
configura-
tion from the drop-down box (
Project
–>
Rebuild
All
to build the optimized version of the program.
Now you can benchmark and profile the program by:
• Taking advantage of the built-in cycle counters of the Blackfin pro-
cessor by including benchmark-gathering code in the program.
• Using the real-time clock (RTC) of the ADSP-BF537 processor.
This clock measures “human-scale” time (seconds, minutes, and so
on).
Both cycle count and real-time are being measured because, as we
learn later, the relationship between the values is not necessarily a
constant multiplier.
• Using the statistical profiler. The statistical profiler is a unique tool
that polls the Blackfin processor hundreds of times per a second.
The data is used to paint a statistical view of the program to deter-
mine where the program spends the majority of its time.
The statistical profiler has a distinct advantage over traditional pro-
filing techniques because it operates non-intrusively (tradition
profiling techniques require an instrumentation of your project),
requiring zero overhead and not influencing your program’s opera-
tion. However, because the profiling is statistical in nature, it
cannot be relied on as a code-coverage tool, and it cannot show
caller information. For this kind of analysis, traditional, instru-
mented profiling is also available.
For the part 2 program, we use the statistical profiler. Enable the statistical
profiler by selecting
Tools
–>
Statistical Profiling
–>
New Profile
. Move
and resize the new window until the viewing space is comfortable to con-
tinue the exercise.
www.BDTIC.com/ADI


