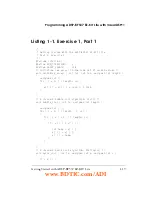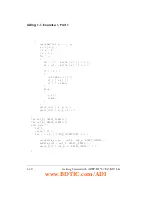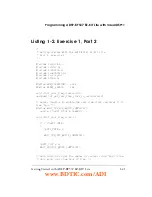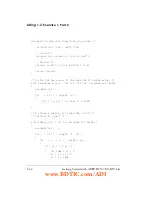
Exercise 1, Part 1: Building and Running the First Program
1-8
Getting Started with ADSP-BF537 EZ-KIT Lite
To visualize the activity discussed in the exercise, create two plot windows,
one for the
out_b
array and one for the
out_m
array. To create a plot win-
dow for the
out_b
array:
1. Select the
View
–>
Debug Windows
–>
Plot
–>
New
menu item.
The
Plot Configuration
dialog box appears.
2. Change
Title
to
Monitoring out_b
.
3. Type
out_b
in the
Address
field.
4. Type
128
(the length of the
out_b
array) in the
Count
field.
5. Change
Data
to
int
(the type of our data).
6. Click
Add
, then click
OK
.
Repeat this procedure to create a plot window for the
out_m
variable
1
,
adjusting steps 2 and 3 accordingly. Once the plot windows are created,
adjust them to comfortable sizes. Your plot windows look similar to those
in
.
Note that both line plots are flat at zero because the data arrays are
zero-initialized by Vi+. We will see Vi+ update the
windows as we step into the program. Issue the
Debug
–>
Step Over
com-
mand (or use the
F10
hotkey) three times to highlight the call to the
bubble_sort()
function as the next instruction to execute. The two plot
windows show the random values to which the arrays are initialized.
Step Over
again to observe that the
out_b
array is now sorted.
Step Over
one more time to observe that
out_m
is also sorted.
Note that the part 1 project uses the debug
configuration
(
).
1
Note that you can add both plots to a single window. However, this is undesirable when two plots
have the same results, causing the plot lines to overwrite each other.
www.BDTIC.com/ADI


