ATA Pro
Technical Manual
Int. Approved
Document ref: HEL-810-12
December 2017
Page 18 of 27
Copyright © 2017 Analox Ltd. All Rights Reserved.
Commercial in Confidence
9.
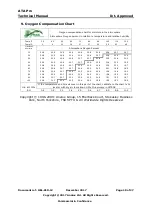
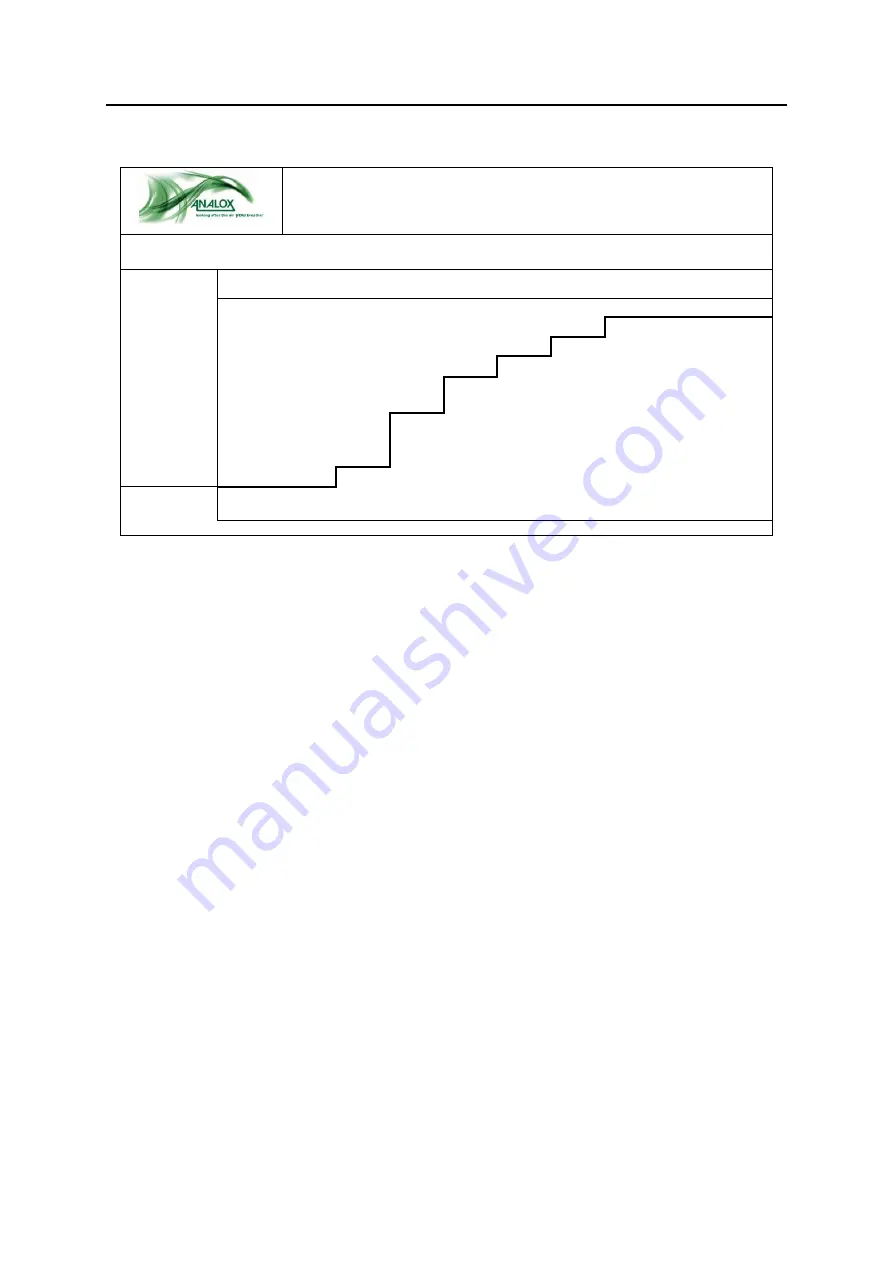
Oxygen Compensation Chart
Oxygen compensation chart for moisture in the atmosphere
Atmosphere Oxygen percent in relation to temperature and relative humidity
Temp °F
32
40
50
60
70
80
90
100
110
120
Temp °C
0
4
10
16
21
27
32
38
43
49
% Relative
Humidity
Atmospheric Oxygen Percent
10
20.9
20.9
20.9
20.9
20.8
20.8
20.8
20.8
20.7
20.7
20
20.9
20.9
20.8
20.8
20.8
20.8
20.7
20.6
20.5
20.4
30
20.9
20.8
20.8
20.8
20.7
20.7
20.6
20.5
20.4
20.2
40
20.8
20.8
20.8
20.7
20.7
20.6
20.5
20.4
20.2
19.9
50
20.8
20.8
20.8
20.7
20.6
20.5
20.4
20.2
20.0
19.7
60
20.8
20.8
20.7
20.7
20.6
20.5
20.3
20.1
19.8
19.5
70
20.8
20.8
20.7
20.6
20.5
20.4
20.2
19.9
19.6
19.2
80
20.8
20.8
20.7
20.6
20.5
20.3
20.1
19.8
19.5
19.0
90
20.8
20.7
20.7
20.6
20.4
20.3
20.0
19.7
19.3
18.7
100
20.8
20.7
20.6
20.5
20.4
20.2
19.9
19.5
19.1
18.5
H
2
0 at 100%
RH
If the temperature and RH axis meet in this part of the chart, calibrate to the chart % O
2
level or with dry air to maintain 0.5% O
2
accuracy in NITROX
0.6
0.8
1.2
1.8
2.5
3.4
4.7
6.5
8.6
11.5
Copyright © 1996-2009: Analox Group, 15 Ellerbeck Court, Stokesley Business
Park, North Yorkshire, TS9 5PT UK.
All Worldwide Rights Reserved.


