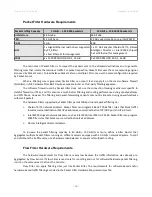
Wanguard 6.2 User Guide
Configuration » General Settings » Graphs & Storage
It is highly recommended to automate the deletion of old data and monitor the disk usage of IP graphs in
Configuration » General Settings » Data Retention.
Sensor and Applications Graph Troubleshooting
✔
Ensure that all Sensors run correctly by verifying the event log and by viewing live statistics from Reports
» Components » Overview. The troubleshooting guide for Packet Sensor is located on page 41, for Flow
Sensor on page 44 and SNMP Sensor on page 49.
✔
Discontinuous Sensor graphs can be caused by enabling IP Accounting for too many/large subnets when
there is a slow connection between the Sensor and MySQL/MariaDB running on the Console server.
IP/Subnet and Profiling Graph Troubleshooting
✔
Ensure that all Sensors run correctly by verifying the event log and by viewing live statistics displayed in
Reports » Components » Overview. The troubleshooting guide for Packet Sensor is located on page 41,
for Flow Sensor on page 44 and SNMP Sensor on page 49.
✔
Generating IP and profiling graph data has the biggest impact on the load of the Console server. Enable
each feature (IP graphing, IP accounting, IP profiling) sequentially for each subnet, after making sure
that the Console server can handle it. The storage requirements for each subnet are listed in the IP
Zone, and the current disk usage in Configuration » General Settings » Data Retention.
✔
The internal program used for saving IP graph data is
/opt/andrisoft/bin/genrrds_ip
. If it is overloading
the Console server or the event log contains warnings such as “Updating IP graph data takes longer than
5 minutes”, use RRDCacheD, RAM/SSD updating method, faster disk drivers, enable IP graphing for
fewer subnets, or deploy a Sensor Cluster configured to aggregate IP graph data.
✔
The internal program used for generating IP or subnet graphs is
/opt/andrisoft/bin/gengraph_ip
.
Console users launch the program for each requested IP or subnet graph. If the Console server gets too
loaded by gengraph_ip, execute “killall gengraph_ip” and configure RRDCacheD. When launched, the
program does not stop until the graph is generated. The program can be slow when users request
subnet graphs for subnets not specifically defined in the IP Zone. It is not possible to throttle the
number of graphs requested by users.
AS and Country Graph Troubleshooting
✔
Ensure that all Sensors run correctly by verifying the event log and by viewing live statistics from Reports
» Components » Overview. The troubleshooting guide for Packet Sensor is located on page 41, for Flow
Sensor on page 44 and SNMP Sensor on page 49.
✔
To enable AS and Country graphs, set the Top Generator parameter to either “Extended” for Flow
Sensor, or “Full” for Packet Sensor.
✔
SNMP Sensor is not able to generate AS graphs or Country graphs.
- 22 -
Summary of Contents for wanguard 6.2
Page 1: ......


