Wanguard 6.2 User Guide
Reports » Tools
interested in.
●
Comments
– This field may contain comments about the packet trace.
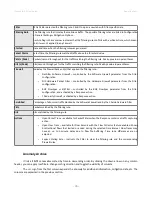
All active Packet Traces are listed in a table having the following format:
●
Description [BPF]
– The description and BPF expression of the trace.
●
Sampling
– The type of sampling being used.
●
From
– The date when the Packet Tracer started capturing packets.
●
Until
– The time or the conditions that will cause the Packet Tracer to stop capturing the traffic.
●
Status
– Indicates the status of the Packet Tracer. It is green if it is running, and red if it is not.
●
Packet Tracer
– The Packet Sensor or the Packet Filter used for capturing packets.
●
Files / Size
– The number of dump files generated and the size of the latest dump file.
●
Packets
– The number of packets captured.
●
Actions
– Click the first icon to view the latest dump file in an integrated packet analyzer interface. Click
the second icon to download the latest dump file to your computer. If downloading does not work, but
viewing does, increase the values of the
max_execution_time
and
memory_limit
from php.ini. Click the
third icon to stop capturing packets.
Packet Trace Archive
By default, packet traces are sorted by time in descending order. By clicking the down arrow of any column
header, you can apply row filters, change sorting direction and toggle the visibility of columns.
The <+> sign from the first column expands each row for additional information about the packet trace and
provides access to packet dump files. The columns are explained in the previous section.
- 85 -
Summary of Contents for wanguard 6.2
Page 1: ......

