Wanguard 6.2 User Guide
Reports » Components
Reports » Components
Reports » Components
contains links to the
Overview
,
Device Group
,
Sensor
and
Filter
tabs.
The Overview tab provides a real-time view on the status of all active Wanguard components and servers.
The Device Group tab provides a real-time view of the Sensor(s) and Filter(s) assigned to the selected device group.
The Sensor tab provides data specific to the selected Sensor. The Filter tab provides data specific to the selected
Filter. Administrators can restrict which device groups, Sensors and Filters are accessible by guest accounts.
Reports » Components » Overview
It shows a few self-refreshing tables that display real-time system parameters collected from all active
Wanguard components and servers:
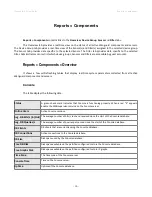
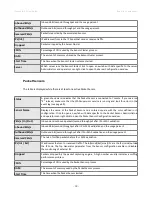
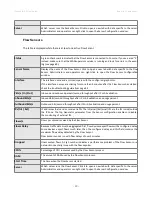
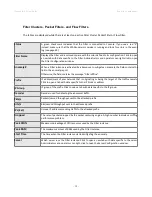
Console
The table displays the following data:
Status
A green check mark indicates that Console is functioning properly. When a red “X” appears,
enable the WANsupervisor service on the Console server.
Online Users
Active Console sessions.
Avg. DB Bits/s (In/Out)
The average number of bits/s sent and received since the start of the Console database.
Avg. DB Queries/s
The average number of queries per second since the start of the Console database.
DB Clients
DB clients that are currently using the Console database.
DB Connections
Active connections to the Console database.
DB Size
Disk space used by the Console database.
Free DB Disk
Disk space available on the partition configured to store the Console database.
Free Graphs Disk
Disk space available on the partition configured to store IP graphs.
Time Zone
The time zone of the Console server.
Console Time
Time on the Console server.
Uptime
Uptime of the Console database.
- 86 -
Summary of Contents for wanguard 6.2
Page 1: ......

