5-3 Create a Combined Signal Map
Signal Map Viewing and Reporting
5-2
PN: 10580-00422 Rev. E
MA8100A UG
5-3
Create a Combined Signal Map
You can combine signal map data from different sources and display them together on the
NEON Command screen.
1.
From the File menu, open a Combined Signal Map.
2.
Add Local or Add Cloud depending on where the signal map you want to add is located.
3.
Navigate to the local signal map log in the Select Signal Map Explorer window, or to
the cloud log in the Select Cloud Log window and select the file.
4.
Add as many signal maps as you wish, then click Open.
5-4
Generate a Heat Map
When you open a signal map log in NEON Command, a list of all the signals that were
detected and geo-referenced is displayed next to the map.
1.
Select the signal type, then click on the individual signals you want to display. You can
also click select all of them.
2.
Generate Map
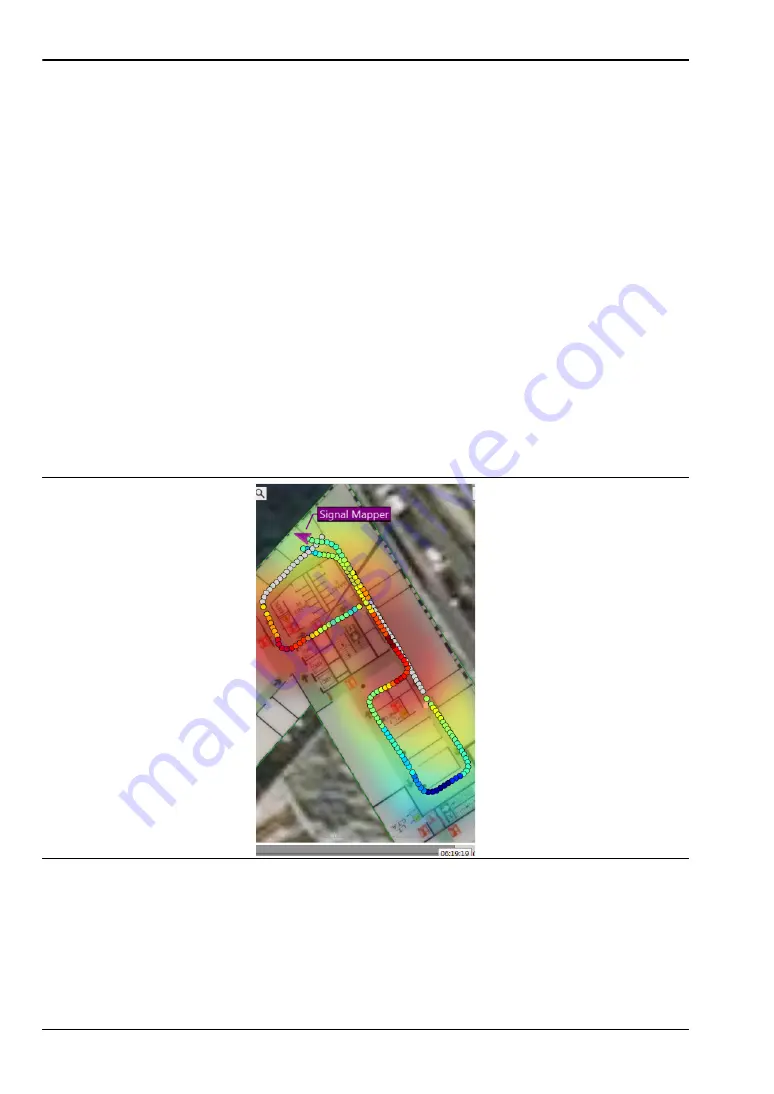
to display the data collected with Signal Mapper. The 2D image will
appear similar to the one in
.
3.
View signal data collected on another building floor,
4.
You may optionally choose a different map type, such as a street view,
5.
The Layers menu lets you turn on and off the display of Building, Personnel, and Signal
Mapper elements.
Figure 5-2.
Heat Map Display in 2D


