4.13 Time Domain Graph Display
4-187
4.13.6 Sampling information display
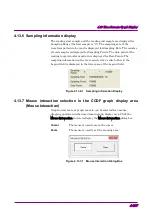
The reading start sample and the reading end sample are displayed for
Sampling Range (the first sample is “0”). The sampling rate of the
waveform pattern to be read is displayed for Sampling Rate. The number
of read samples is displayed for Sampling Points. The data point of the
reading target waveform pattern is displayed for Data Points. The
sampling information on the trace selected by a radio button in the
Legend field is displayed in the lower area of the Legend field.
Figure 4.13.6-1 Sampling Information Display
4.13.7 Mouse interaction selection in the CCDF graph display area
(Mouse Interaction)
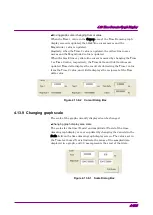
Graph cursor move or graph zoom-in can be selected for a mouse
dragging operation in the time domain graph display area. Click the
Mouse Interaction button to display the Mouse Interaction dialog box.
Cursor
The mouse is used to move the cursor.
Zoom
The mouse is used to set the zooming area.
Figure 4.13.7-1 Mouse Interaction Dialog Box


