4.13 Time Domain Graph Display
4-189
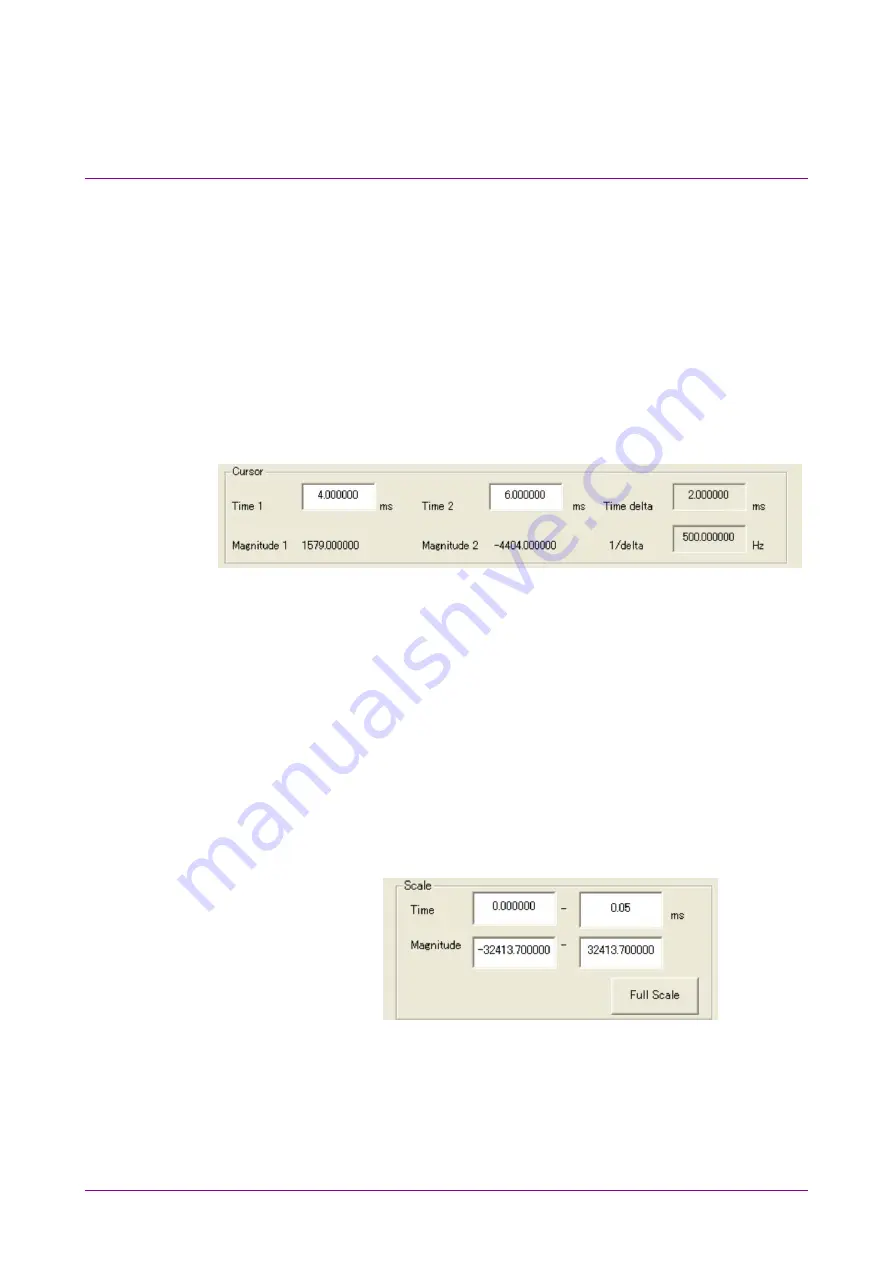
■Moving graph cursor
changing Cursor value
When the Time 1 value in the Cursor area of the Time Domain graph
display screen is updated, the black-line cursor moves and the
Magnitude 1 value is updated.
Similarly, when the Time 2 value is updated, the yellow-line cursor
moves and the Magnitude 2 value is updated.
When the black-line or yellow-line cursor is moved by changing the Time
1 or Time 2 value, respectively, the Time delta and 1/delta values are
updated. Time delta displays the result of subtracting the Time 1 value
from the Time 2 value, and 1/delta displays the reciprocal of the Time
delta value.
Figure 4.13.8-2 Cursor Dialog Box
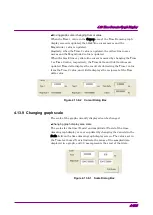
4.13.9 Changing graph scale
The scale of the graph currently displayed can be changed.
■Changing graph display area scale
The scales for the time (X axis) and amplitude (Y axis) of the time
domain graph display area are updated by changing the value(s) in the
Scale field on the time domain graph display screen. The values set in
the Time text boxes (X axis) indicate the range of the sampled data
displayed in a graph, and 0.0 ms represents the start of that data.
Figure 4.13.9-1 Scale Dialog Box


