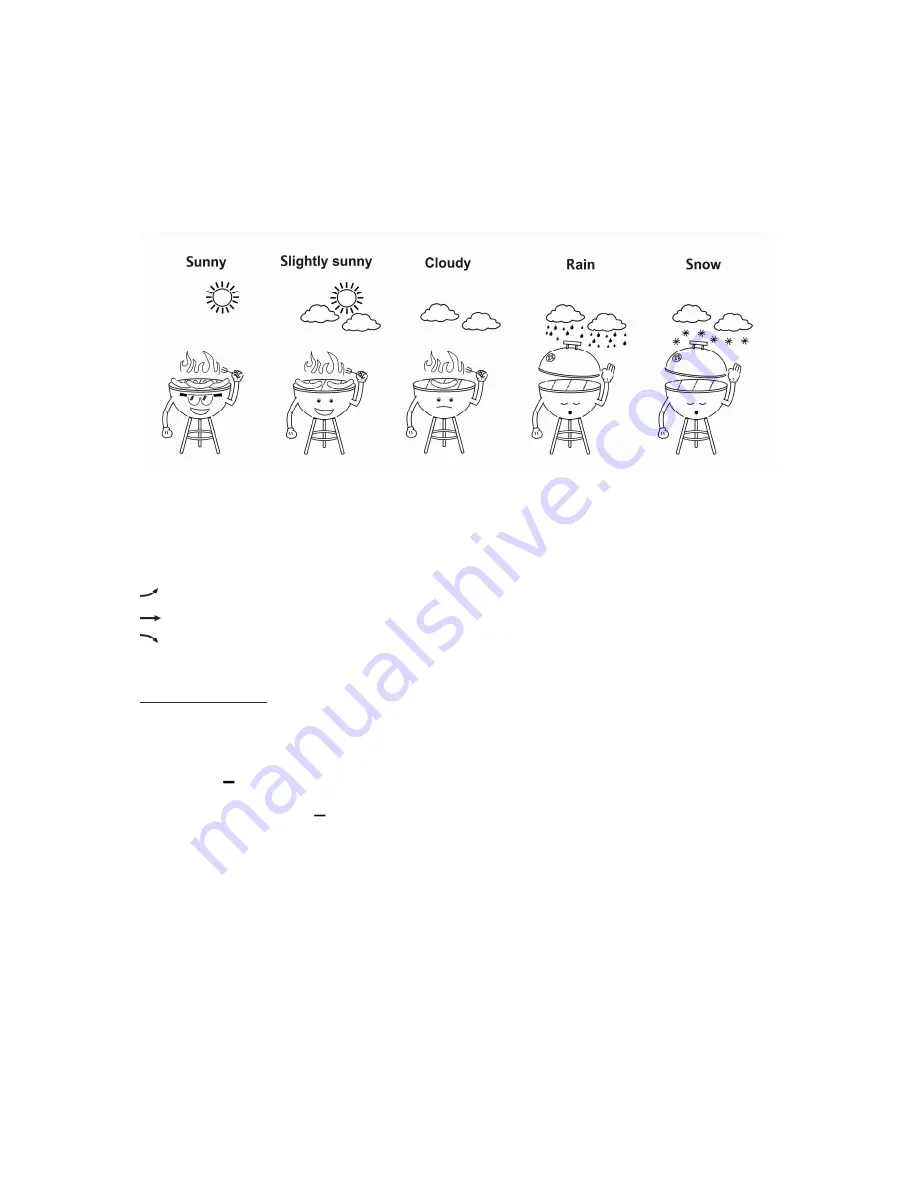
After setting up initially, the weather forecast can not be used for about 12 hours, as the weather station
needs this time to collect and evaluate the weather data.
The weather forecast is a result of the collected data and the measured changes in air pressure.
The forecast refers to the area around the weather station with a radius of about 30 to 50 km for the next 12
to 24 hours.
The accuracy of the weather forecast is around 75 %.
When the symbol for the weather forecast begins to flash and the air pressure falls, this is a sign that the
weather is getting worse.
When the air pressure increases again, the symbols display continuously again. An arrow shows the
weather tendency.
rising air pressure = weather will improve
constant air pressure = weather will stay the same
falling air pressure = weather will get worse
Air pressure
You can select absolute or relative air pressure by pressing and holding the
HIRSTORY
button, Rel. or
Abs. will flash on the display.
1. Use
+
or
buttons to select and press
HIRSTORY
button to confirm, the air pressure value will flash.
2. Set value with the
+
and buttons.
3. Press
HIRSTORY
button to confirm.
12- hour air pressure history
– Press the
HIRSTORY
button to display the air pressure history for the
last 12 hours.
0 HR = current air pressure
-1 HR = air pressure 1 hour ago
- 2 HR = air pressure 2 hours ago… and so on
The current prevailing air pressure is also displayed in hPa or inHg .


