13
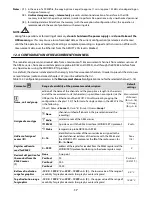
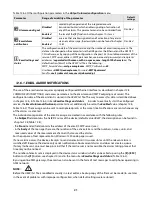
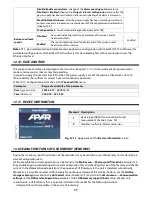
11.4. VIEW OF A MEASUREMENT GROUP (ANALOG INDICATOR, COUNTER)
Fig. 11.4.
Appearance of a measurement group screen in the
ANALOG INDICATOR
mode (presentation max. 6 channels is
possible)
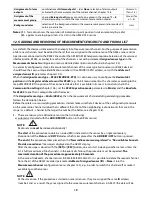
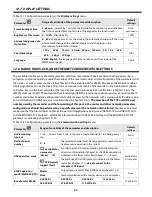
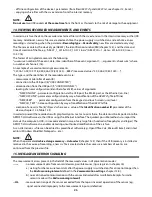
11.5. SINGLE MEASUREMENT (CHART)
Fig. 11.5.
Appearance of a single measurement screen in the
CHART mode
(possibility to present one channel)
12. SETTING PARAMETERS AND OPERATIONS ON FILES (MAIN MENU)
All the configuration parameters, names of channels and groups, and measurement units of the recorder are
stored in the non-volatile internal memory in two text files:
AR407.cfg
(numerical parameters) and
AR407.txt
(names, units, groups, etc.) - changes can be implemented only using a computer in the ARSOFT-CFG software via
the USB port or the Ethernet, as well as in any text editor, e.g. Windows Notebook).
When the device is switched on for the first time, the measurement channels list is empty and new sensors must
be added (chapter 12.5).
As a standard, the parameter configuration can be performed using one of the following three methods (
do not
use them at the same time
):
1.
From the film keypad and a touch screen located on the front panel of the device:
- from the mode where the input measurements are displayed in the
Main Menu
(
[SET]
button). If
Password
Protection
in
Access and other settings
is on, enter the password - the default value is
1111
; see chapter 12.9
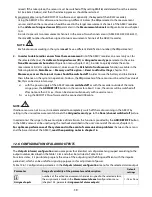
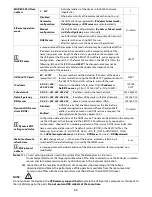
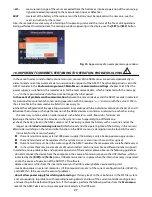
Fig. 12.
Appearance
of the password
screen and the
Main
Menu
Object
Description
1
status bars (chapter 11.1)
2
measurement panel: number, name, measured
value, and unit of the measurement channel
(chapter 11.2), graphic presentation of the
measurement (analog indicator) works in the
range set by the parameters
Bottom…
and
Top of
indication range for graphics
(chapt. 12.4 and 12.5)
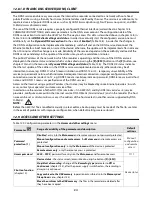
Object
Description
1
status bars (chapter 11.1)
2
measurement panel: number, name, measured
value, and unit of the measurement channel
(chapt.11.2), graphic presentation of the measure-
ment (diagram) works in the range set by the
parameters
Bottom of indication range for gra-
phics
,
Top of indication range for graphics
(chapt.
12.4 and 12.5), and
Chart time range
(chapt.12.8)
Summary of Contents for AR407
Page 32: ...32 21 USER S NOTES...


