49
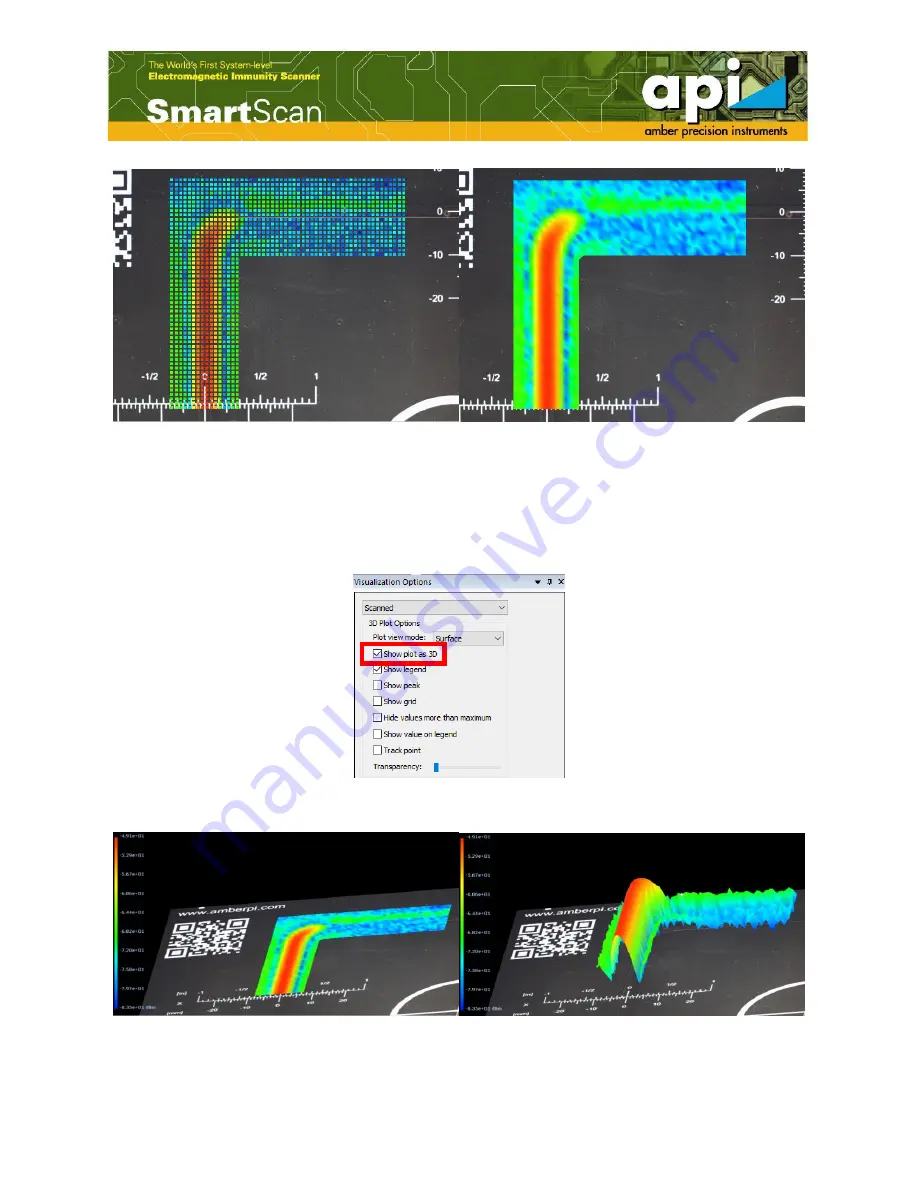
Figure 80: Data display in "Points" mode (left) and "Surface" mode (right).
5.1.2.
Show Plot as 3D
SmartScan software displays the scan results in 2D as default. 3D plots can be displayed by
selecting the option "Show plot as 3D" in "3D Plot Options" list as shown in Figure 81.
Figure 81: Show plot as 3D.
Figure 82: Data display in 2D (left) and 3D (right).


