11
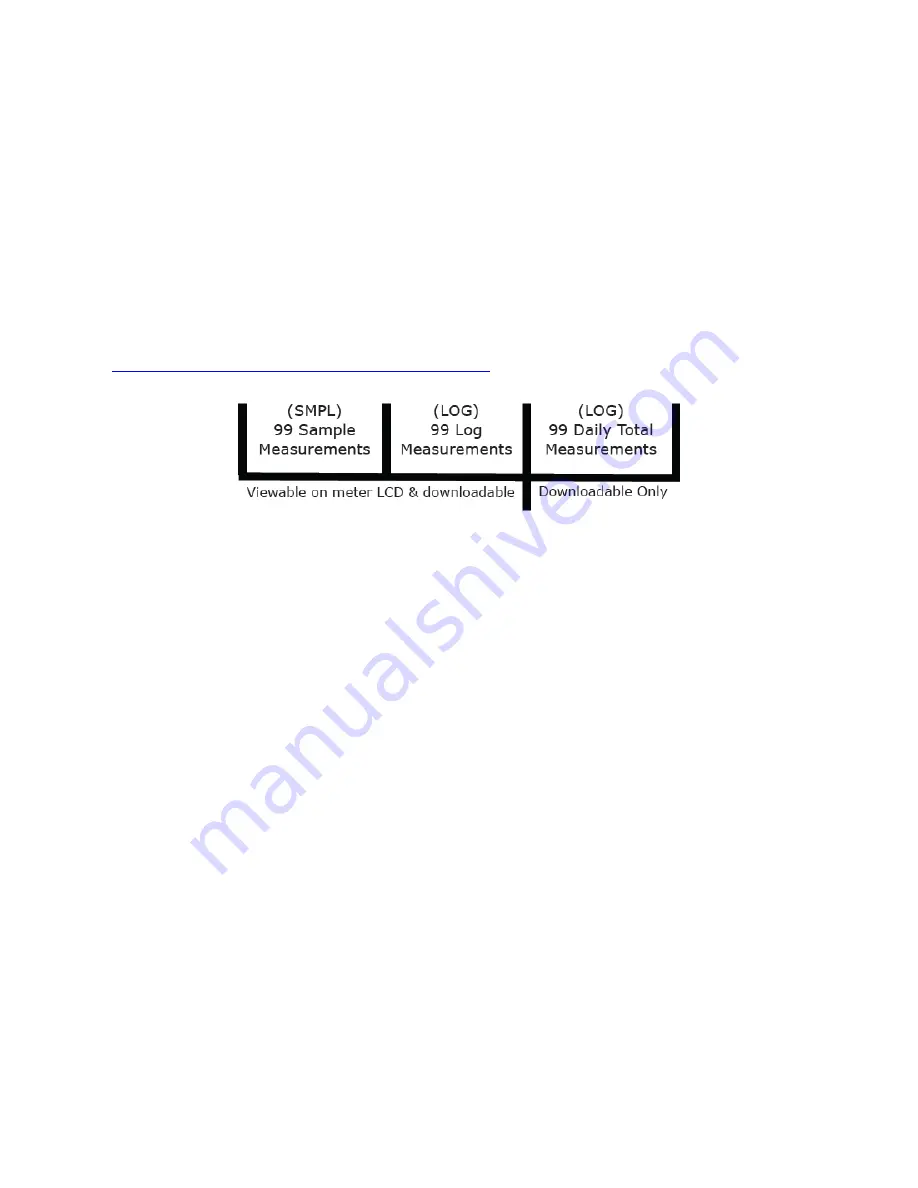
overwrite the oldest measurement once there are 99 measurements. Every 48 averaged measurements (making a 24 hour
period), the meter will also store an integrated daily total in moles per meter squared per day (mol m
-2
d
-1
).
Reset:
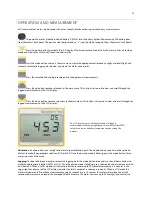
To reset the meter, in either SMPL or LOG mode, push the mode button three times (RUN should be blinking), then
while pressing the down button, press the mode button once. This will erase all of the saved measurements in memory, but
only for the selected mode. That is, performing a reset when in SMPL mode will only erase the manual measurements and
performing a reset when in LOG mode will only erase the automatic measurements.
Review/Download Data:
Each of the logged measurements in either SMPL or LOG mode can be reviewed on the LCD
display by pressing the up/down buttons. To exit and return to the real-time readings, press the sample button. Note that the
integrated daily total values are not accessible through the LCD and can only be viewed by downloading to a computer.
Downloading the stored measurements will require the AC-100 communication cable and software (sold separately). The
meter outputs data using the UART protocol and requires the AC-100 to convert from UART to USB, so standard USB cables
will not work. Set up instructions and software can be downloaded from the Apogee website
(
http://www.apogeeinstruments.com/ac-100-communcation-cable/
).
Spectral Errors and Yield Photon Flux Measurements
Apogee quantum meters are calibrated to measure PPFD for either sunlight or electric light (menu selectable). The difference
between the calibrations is 12 %. A sensor calibrated for electric lights (calibration source is T5 cool white fluorescent lamps)
will read approximately 12 % low in sunlight.
In addition to PPFD measurements, Apogee MQ series quantum meters can also be used to measure yield photon flux
density (YPF): photon flux weighted according to the plant photosynthetic action spectrum (McCree, 1972) and summed.
YPFD is also expressed in units of µmol m
-2
s
-1
, and is similar to PPFD, but is typically more closely correlated to
photosynthesis than PPFD. PPFD is usually measured and reported because the PPFD spectral weighting function (equal
weight given to all photons between 400 and 700 nm; no weight given to photons outside this range) is easier to define and
measure, and as a result, PPFD is widely accepted. The conversion factor to calculate YPFD from the PPFD measurements
displayed on the LCD is 0.90 and 0.89 for sunlight and electric light measurements, respectively.
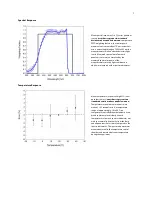
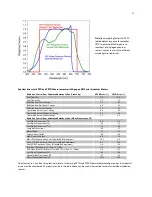
The weighting functions for PPFD and YPFD are shown in the graph below, along with the spectral response of Apogee
quantum sensors. The closer the spectral response matches the defined PPFD or YPFD spectral weighting functions, the
smaller spectral errors will be. The table below provides spectral error estimates for PPFD and YPFD measurements from light
sources different than the calibration source. The method of Federer and Tanner (1966) was used to determine spectral errors
based on the PPFD and YPFD spectral weighting functions, measured sensor spectral response, and radiation source spectral
outputs (measured with a spectroradiometer). This method calculates spectral error and does not consider calibration,
cosine, and temperature errors.
Federer, C. A., and C. B. Tanner, 1966. Sensors for measuring light available for photosynthesis. Ecology 47:654-657.
McCree, K. J., 1972. The action spectrum, absorptance and quantum yield of photosynthesis in crop plants. Agricultural
Meteorology 9:191-216.


