Appendix C Data Explorer Toolbox (Visual Basic Macros)
C-16
Applied Biosystems
C
3.
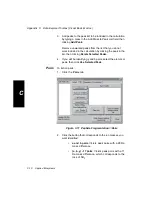
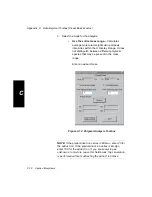
Select the mode for the analysis:
•
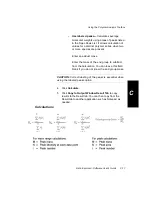
Use the entire mass range—Calculates
average molecular weights using all peak
intensities within the X Display Range. It does
not distinguish between different polymeric
species that may be present in the mass
range.
Enter an adduct mass.
Figure 3-14 Polymer Analysis Toolbox
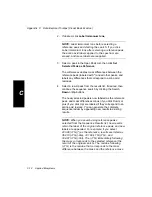
NOTE: If the predominant ion series is M+Na+, enter 23 for
the adduct ion. If the predominant ion series is M+Ag+,
enter 108 for the adduct ion. If you are analyzing an
unknown or a mixture, leave this field blank; the calculation
is performed without subtracting the adduct ion mass.
Summary of Contents for Data Explorer 4 Series
Page 1: ...Data Explorer Software Version 4 Series Software User Guide ...
Page 10: ...Table of Contents x Applied Biosystems ...
Page 56: ...Chapter 1 Data Explorer Basics 1 42 Applied Biosystems 1 ...
Page 98: ...Chapter 2 Using Chromatogram and Spectrum Windows 2 42 Applied Biosystems 2 ...
Page 172: ...Chapter 3 Peak Detection and Labeling 3 74 Applied Biosystems 3 ...
Page 204: ...Chapter 4 Examining Chromatogram Data 4 32 Applied Biosystems 4 ...
Page 270: ...Chapter 5 Examining Spectrum Data 5 66 Applied Biosystems 5 ...
Page 316: ...Chapter 6 Using Tools and Applications 6 46 Applied Biosystems 6 ...
Page 384: ...Chapter 9 Troubleshooting 9 22 Applied Biosystems 9 ...
Page 388: ...Appendix A Warranty A 4 Applied Biosystems A ...
Page 416: ...Appendix C Data Explorer Toolbox Visual Basic Macros C 20 Applied Biosystems C ...


