Smartlog
- 51 -
9.2 DATA BACKUP AND VIEWING
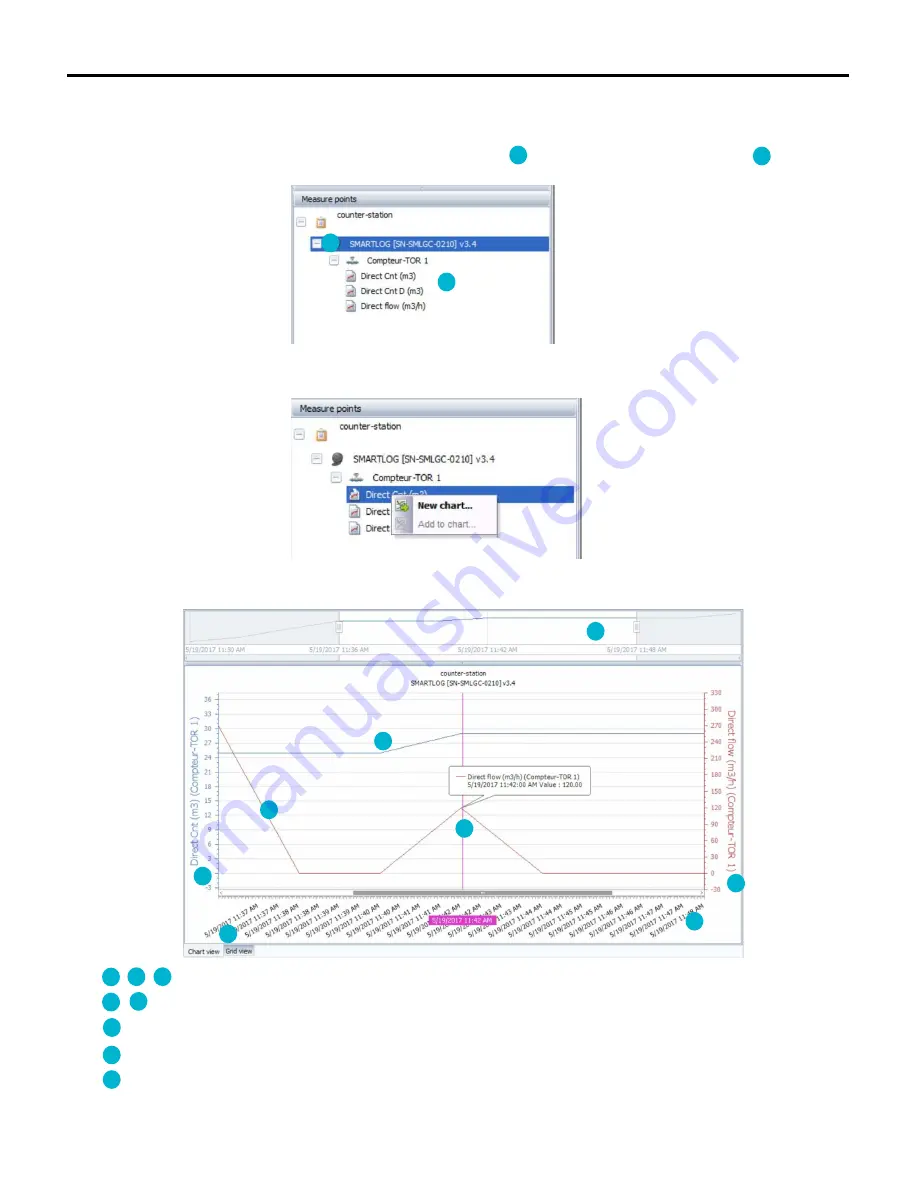
After having recorded your Smartlog data, they can be viewed, exported and analysed using Aquamonitor.
To do this, select your measuring point, and then deploy the desired Smartlog. The list of saved values is then displayed.
To display a set of data, double click on the desired set or right click on "New graph”. If a graph is already open, you can add a data set by right
clicking on "Add to the graph”.
Aquamonitor then creates the graphical representation of the data set and displays it in the main window.
, , : Scales and titles of axes
, : Plots of the data series
: Cursor, place the mouse over the graph to have the cursor automatically appear
: Time interval zoom-in window (move the markers left and right to zoom in on a specific time period)
: Switch from the graphical display to the points table
1
2
3
4
5
6
7
8
9
10
1
2
10
3
4
5
6
7
8
9
Summary of Contents for SMARTLOG
Page 1: ...SMARTLOG User manual Version 1 0 ...
Page 2: ...Smartlog 2 ...


