Smartlog
- 57 -
9.4 CREATE AN INTERPOLATION TABLE
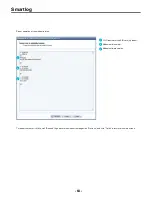
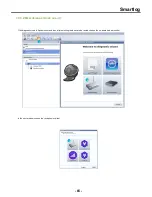
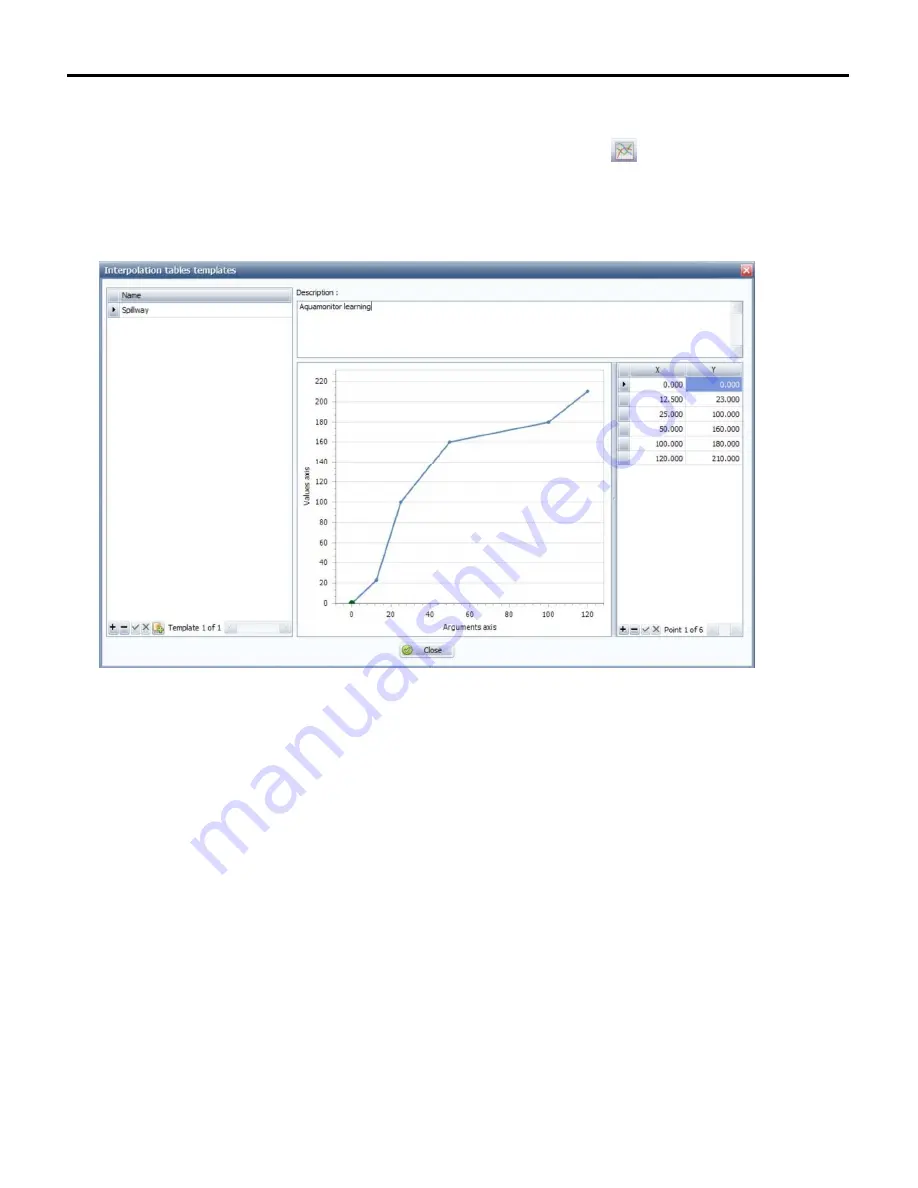
To create an interpolation table that will allow the height-flow rate conversion in the Smartlog, click or “Tools” and then “Spillway models”.
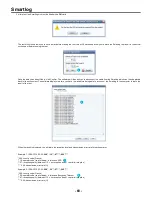
A window will open to allow you to fill in all the points of your interpolation table. Your interpolation table can contain up to 32 points maximum and
must be strictly increasing.
The X-axis of the justifications, matches the height measured by the sensor, and the Y-axis of the ordinates matches the interpolated flow rate. The
units of these quantities are set when configuring the Smartlog.
Once your interpolation tables have been created you can use them in your Smartlog configured in “Storm spillway” by clicking “Open an interpolation
table” during the configuration (see8.3 Storm spillway).
Summary of Contents for SMARTLOG
Page 1: ...SMARTLOG User manual Version 1 0 ...
Page 2: ...Smartlog 2 ...


