C2.1
About the PMU
The processor includes performance monitors that enable you to gather various statistics on the operation
of the processor and its memory system during runtime. They provide useful information that you can
use when debugging or profiling code.
The PMU provides six counters. Each counter can count any of the events available in the processor. The
absolute counts that the PMU records might vary because of pipeline effects. This variability only has an
impact on the operation of the PMU when a counter is enabled for a short time.
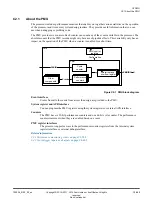
PMU
Interrupt and
overflow registers
nPMUIRQ
Performance
counters
Cycle
counter
Other
components
Events
Core
CLKIN
PMU control
registers
Configuration
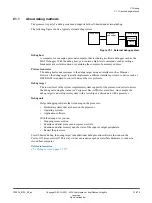
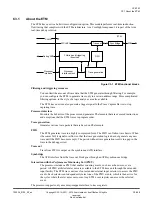
Figure C2-1 PMU block diagram
Event interface
Events from all other units from across the design are provided to the PMU.
System register and APB interface
You can program the PMU registers using the system registers or external APB interface.
Counters
The PMU has six 32-bit performance counters and one 64-bit cycle counter. The performance
counters increment when they are enabled based on events.
PMU register interfaces
The processor supports access to the performance monitor registers from the internal system
register interface or external debug interface.
Related information
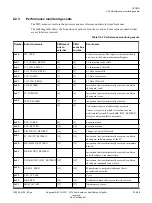
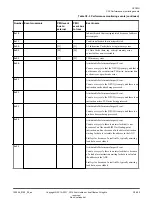
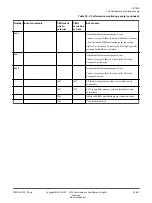
C2.3 Performance monitoring events
on page C2-588
C4.2 Cross-trigger inputs and outputs
on page C4-605
C2 PMU
C2.1 About the PMU
100236_0100_00_en
Copyright © 2015–2017, 2019 Arm Limited or its affiliates. All rights
reserved.
C2-586
Non-Confidential
Summary of Contents for Cortex-A35
Page 4: ......
Page 18: ......
Page 26: ......
Page 27: ...Part A Functional Description ...
Page 28: ......
Page 145: ...Part B Register Descriptions ...
Page 146: ......
Page 573: ...Part C Debug ...
Page 574: ......
Page 845: ...Part D Appendices ...
Page 846: ......

