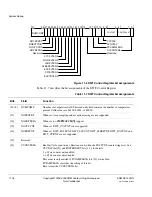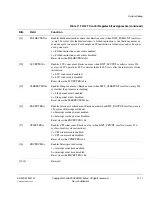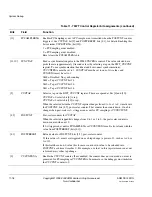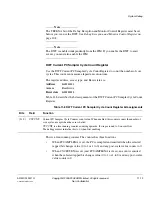
System Debug
11-30
Copyright © 2005-2008 ARM Limited. All rights reserved.
ARM DDI 0337G
Non-Confidential
Unrestricted Access
11.6
ITM
The ITM is a an optional application driven trace source that supports printf style
debugging to trace
Operating System
(OS) and application events, and emits diagnostic
system information. The ITM emits trace information as packets. There are three
sources that can generate packets. If multiple sources generate packets at the same time,
the ITM arbitrates the order in which packets are output. The three sources in decreasing
order of priority are:
•
Software trace. Software can write directly to ITM stimulus registers. This emits
packets.
•
Hardware trace. The DWT generates these packets, and the ITM emits them.
•
Time stamping. Timestamps are emitted relative to packets. The ITM contains a
21-bit counter to generate the timestamp. The Cortex-M3 clock or the bitclock
rate of the
Serial Wire Viewer
(SWV) output clocks the counter.
11.6.1
Summary and description of the ITM registers
Note
TRCENA of the Debug Exception and Monitor Control Register must be enabled
before you program or use the ITM, see
Debug Exception and Monitor Control Register
on page 10-8.
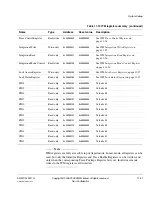
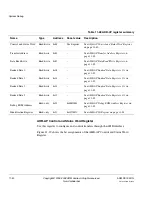
Table 11-19 lists the ITM registers.
Note
You can configure any of the ITM registers to be present or not present. Any register
that is configured as not present reads as zero.
Table 11-19 ITM register summary
Name
Type
Address
Reset value
Description
Stimulus Ports 0-31
Read/write
0xE0000000
-
0xE000007C
-
See
ITM Stimulus Ports 0-31
on page 11-32
Trace Enable
Read/write
0xE0000E00
0x00000000
See
ITM Trace Enable Register
on
page 11-32
Trace Privilege
Read/write
0xE0000E40
0x00000000
See
ITM Trace Privilege Register
on
page 11-33

