47
Results
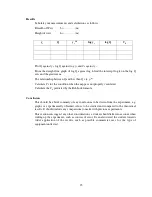
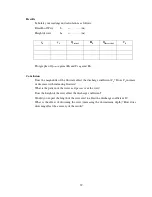
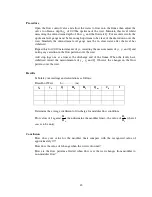
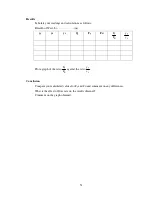
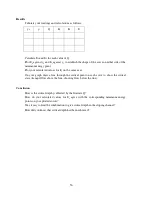
Tabulate your readings and calculations as follows:
Breadth of weir, b = ……………..(m).
y
g
y
o
y
1
Q
C
d
H
0
H
1
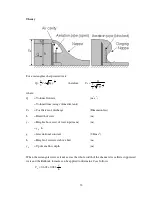
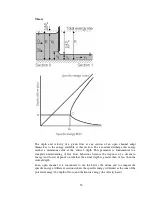
Plot graphs of Q against y
g
for constant y
0
and y
0
against y
g
for constant Q to show the
characteristics of flow beneath the weir.
Plot graphs of C
d
against Q for constant y
0
and C
d
against y
g
for constant Q to show the
changes in C
d
of flow beneath the weir.
Conclusion
Comment on effects of y
o
and Q on the discharge coefficient C
d
for flow underneath the
gate. Which factor has the greatest effect?
Comments on any discrepancies between actual and expected results.
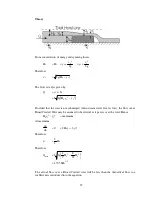
Compare the values obtained for H
1
and H
0
and comment on any differences.

