4
TEMS™ VISUALIZATION 7.3 ENTERPRISE
RF TROUBLESHOOTING – QUICKLY PINPOINT THE ROOT OF NETWORK
PERFORMANCE DEGRADATIONS
To troubleshoot performance degradations in today’s complex networks,
RF engineers often need more information than is available from basic KPI
counter data, alarms and trouble-tickets. To help them get to the root-
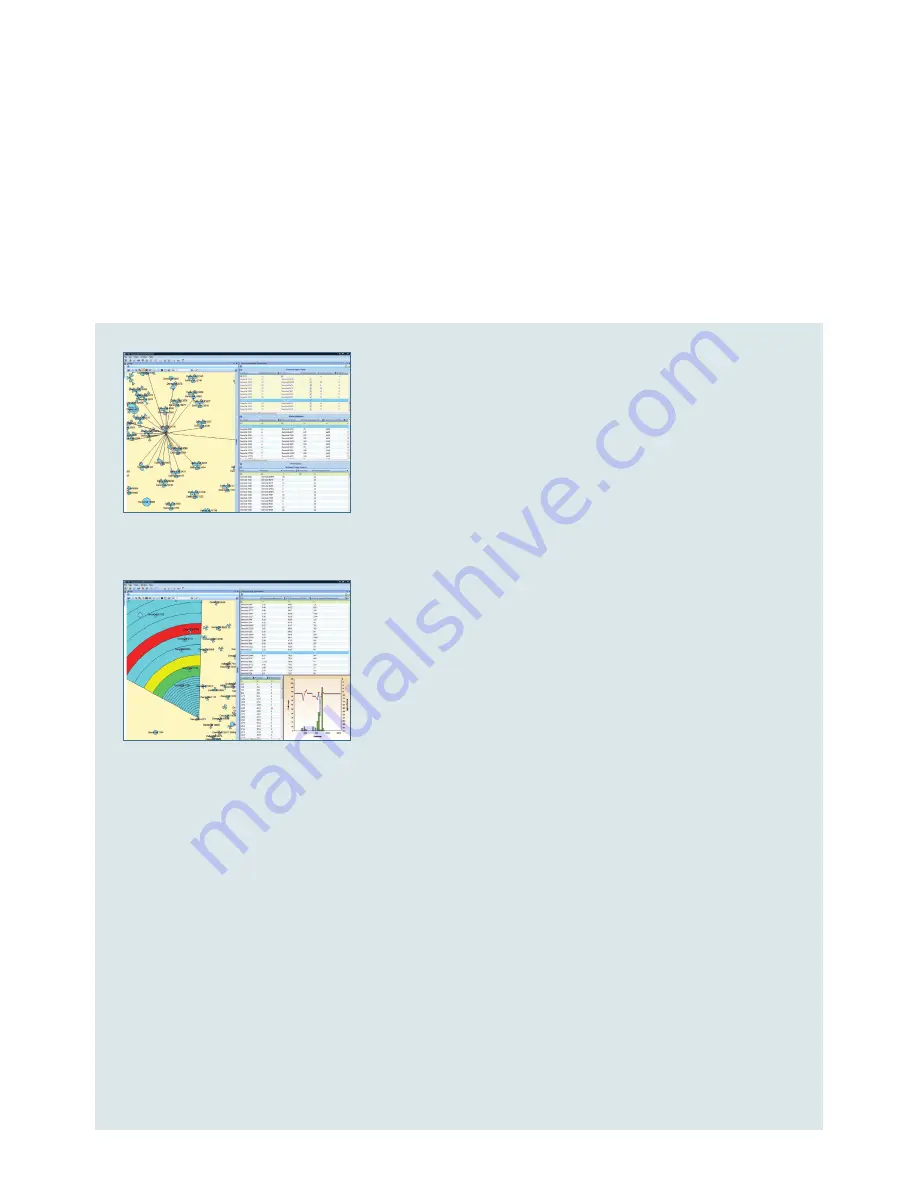
causes of problems efficiently, TEMS Visualization processes, organizes
and visualizes large volumes of calls generated by real subscribers and
allows:
Performance problems such as dropped and blocked calls to be
attributed to specific cells, subscribers or phone types
–
with KPIs
aggregated from the event data
Approximate locations of performance problems to be identified with
geo-location features for WCMDA
Basic RF and capacity issues, which are causing performance degrada-
tions, to be easily identified using the automated diagnostics features
for WCDMA
Direct drill-down from all features, enabling engineers to analyze in
detail the data from individual calls and messages so they can trap,
track, and eradicate problems based on message sequences and
specific phone models
KPI views
Aggregated from WCDMA GPEH and LTE CellTrace data with direct
drill-down to detailed call analysis
Accessibility, retainability, mobility and WCDMA data integrity (high-
speed throughput and channel switching)
Per cell and per cell group and, for WCDMA, per subscriber and per
subscriber group – these views enables engineers to investigate
performance problems for TEMS™ Automatic units, important corporate
customer groups, or VIPs
Per main service type (e.g., CS speech, PS Interactive R99/HS, PS
Interactive EUL/HS) for WCDMA, and per QCI for LTE
Charts for quick identification of worst performers
POWERFUL, UNIQUE FEATURES
Intra-frequency Neighbor Optimization
Coverage Area Optimization


