Atmel AVR2052
9
8200M-AVR-11/11
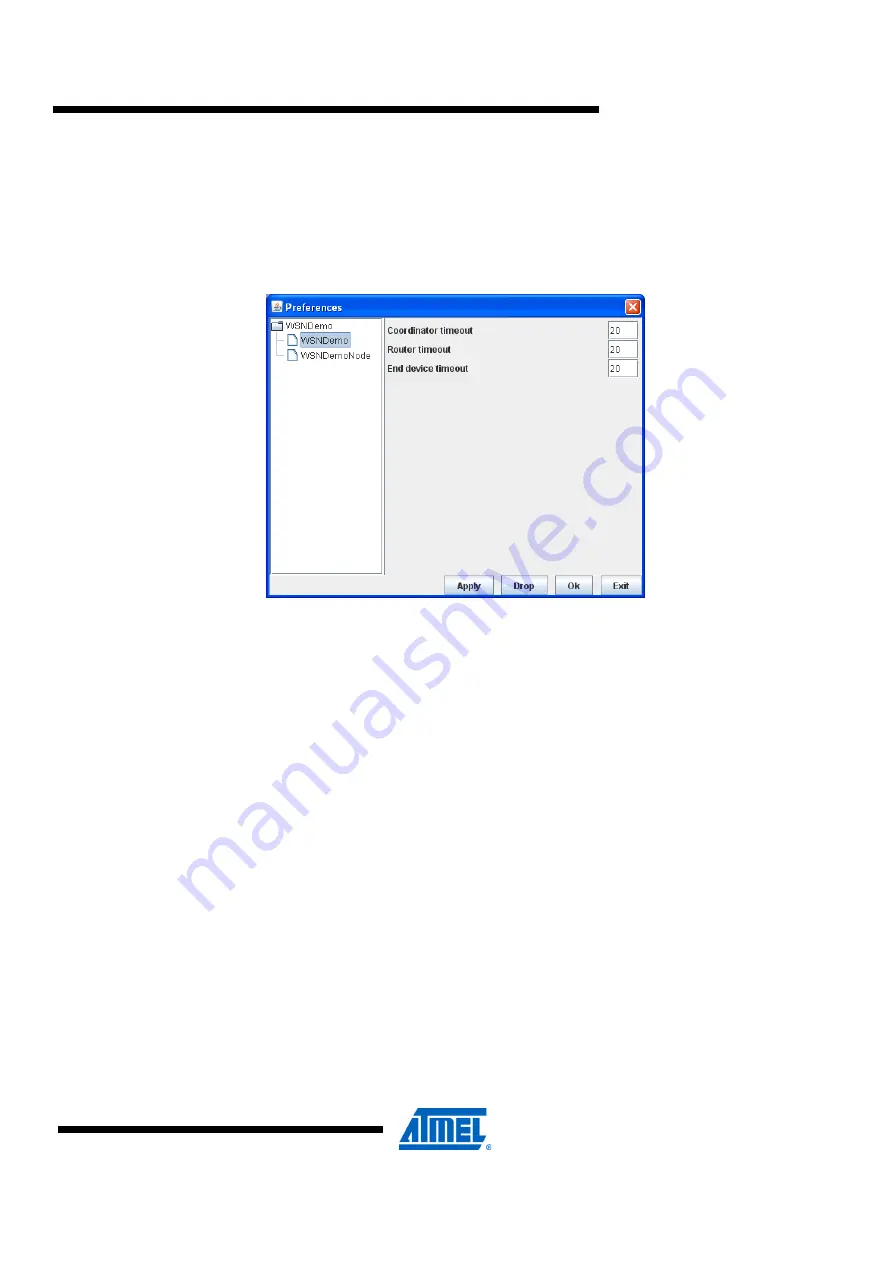
particular node before assuming that the node is no longer part of the network. Note
that this value does not correspond to the frequency with which data are transmitted
by each type of device. To get smooth topology visualization, setting timeouts to 20
seconds is recommended for coordinator and router, and 30 seconds is
recommended for an end device. Assuming a default application configuration, these
timeouts cover three periods between sending a packet, and so at least three packets
would need to be lost before a node is removed from the WSNMonitor topology pane.
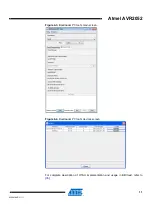
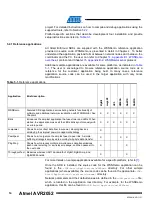
Figure 4-2.
WSNMonitor preferences menu.
4.5.2 Sensor data visualization
Each board sends temperature/light/battery sensor readings (or emulated values) to
the coordinator, which in turn sends it to the PC. WSNMonitor displays the readings
from onboard sensors next to a node icon inside the topology pane. A corresponding
option can be selected in the node/link parameters from the quick settings toolbar.
The user can select any node in the topology pane to monitor the node’s activity and
see the node data in one of three different forms:
•
Text table
•
Chart
•
The onboard sensor’s data displayed next to each node in the topology pane.
These values are also tipped with arrows indicating whether the value increased
or decreased in relation to the previous sample
NOTE
A given node is selected when it is clicked on and a dashed frame is visible around it.
The same values are shown on the sensor data pane, enabling the user to observe
how the values change over a period of time.
The sensor data pane includes a sensor selection combo-box. Use the button on the
sensor control toolbar to display the desired types of sensor data.
4.5.3 Over-the-air upgrade
Over-the-air upgrade (OTAU) can be executed on supported hardware platforms by
loading a special version of the WSNDemo application with OTA support. This
demonstration also requires an additional in-network device to perform the role of the


