background image

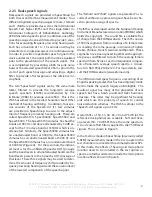
2.2.3  Real-speech signals

Real-speech  signals  are  provided  in  Speechmap  for 

both On-ear and Test box measurement modes.  Four 

different digitized speech passages (2 male, 1 female 

and 1 child) are provided as well as the International 

Speech  Test  Signal  (ISTS)  and  the  single-talker  In-

ternational  Collegium  of  Rehabilitative  Audiology 

(ICRA) distorted speech signal.  In addition, one of the 

speech passages has been filtered to provide 3 varia-

tions for evaluating frequency-lowering hearing aids.  

Each has a duration of 10 – 15 seconds and may be 

presented as a single passage or in a continuous loop.  

In order to provide a repeatable speech signal to the 

device under test, the signal path must be equalized 

prior to the presentation of the speech signal.  This 

is  accomplished  by  presenting  a  896  ms  pink  noise 

burst at the selected speech level, 256 ms prior to the 

start of each speech passage and adjusting a digital 

filter to provide a flat response at the reference mi-

crophone.

The  two “Speech-std”  signals  are  by  the  same  male 

talker,  filtered  to  provide  the  long-term  average 

speech  spectrum  (LTASS)  recommended  by  Cox 

& Moore (1988) for average vocal effort.  This is the 

LTASS assumed in the Desired Sensation Level (DSL) 

method of hearing aid fitting.  In addition, four spe-

cial  versions  of  the  Speech-std  (1)  test  stimulus 

are  provided  in  Speechmap  to  assist  in  the  adjust-

ment of frequency-lowering hearing aids.  These are 

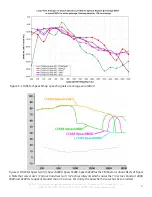
called  Speech3150,  Speech4000,  Speech5000  and 

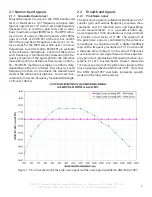
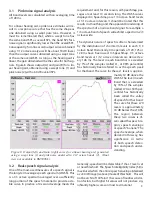
Speech6300.  The Speech3150 stimulus has had the 

bands at 1000 Hz and above attenuated by 30 dB ex-

cept for the 1/3 octave band at 3150 Hz which is un-

attenuated.  Similarily, the Speech4000 stimulus has 

an  unattenuated  band  at  4000  Hz,  the  Speech5000 

stimulus has an unattenuated band at 5000 Hz and 

the Speech6300 stimulus has an unattenuated band 

at 6300 Hz (Figure 4).  For these stimuli, the indicat-

ed level is for the unfiltered Speech-std (1) passage 

and the band levels in all unattenuated bands are the 

band levels present in the Speech-std (1) passage at 

that level.  These three signals may be used to deter-

mine the amount of frequency shift provided by fre-

quency-lowering hearing aids and the sensation level 

of the lowered components of the speech signal.

The “female” and “child” signals are presented “as re-

corded” without any processing and have been cho-

sen to provide a range of spectra.

The ISTS was developed under the European Hearing 

Instrument Manufacturers Association (EHIMA) which 

holds the copyright.  The sound file is available free 

of charge from the EHIMA website.  The ISTS consists 

of 500 ms segments from recordings of 6 female talk-

ers  reading  the  same  passage  in  American  English, 

Arabic, Chinese, French, German and Spanish.  These 

segments have been spliced together with appropri-

ate pauses and filtered to match the average female 

spectrum from Byrne et al, An international compari-

son of long-term average speech spectra. J. Acoust. 

Soc. Am. 96 (1994), 2108-2120.  For more details, con-

sult the EHIMA website (www.ehima.com).

The ICRA distorted speech signal is a recording of an 

English-speaking talker that has been digitally modi-

fied  to  make  the  speech  largely  unintelligible.   The 

resultant  signal  has  many  of  the  properties  of  real 

speech  but  has  a  harsh  sound  and  lacks  harmonic 

structure.   The  latter  may  be  significant  for  hearing 

aids  which  use  this  property  of  speech  to  control 

noise reduction schemes.  The LTASS is similar to the 

“Speech-std” signals up to 5 kHz.

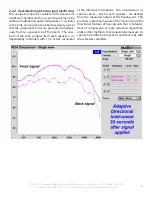
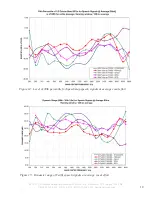
Overall  SPLs  of  50,  55,  60,  65,  70  and  75  dB  (at  the 

reference microphone) are available.  Soft and Aver-

age levels (50 - 70 dB SPL) have the same spectrum.  

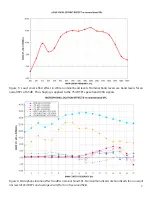
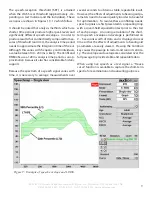
A Loud vocal effort filter is applied to the 75 dB level 

signals.  This is shown in Figure 5.

In the Test box mode in Speechmap (previously called 

S-REM) measurements made in the 2 cc coupler in the 

test chamber are converted to estimated real ear SPL.  

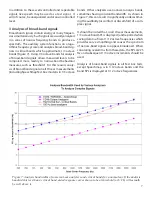
In this mode, the effects of hearing aid microphone 

location  need  to  be  included  in  the  test  signals  so 

spectra are further altered to include the microphone 

location effects shown in Figure 6.

09/01/29 © Etymonic Design Incorporated, 41 Byron Ave., Dorchester, ON, Canada  N0L 1G0


USA 800-265-2093  519-268-3313  FAX 519-268-3256  www.audioscan.com

4

Summary of Contents for RM500SL

Page 1: ...RM500SL User s Guide Version 3 4 March 2010...

Page 2: ...s 21 Saving test setup 21 5 Networking 23 Section overview 23 Networking requirements 23 Networking setup 23 Single computer connection 24 6 Printing and Storing Results 25 Section overview 25 Interna...

Page 3: ...lator operation 50 11 On Ear Measures Setup 52 Section overview 52 On ear calibration facts 52 Calibration of on ear probe microphone 52 Calibration check for probe module 53 Max TM SPL setup 54 ABR n...

Page 4: ...for loud sounds 83 Fitting to targets for mid level speech 84 Open fittings in Speechmap 84 Verifying Frequency Compression Frequency Lowering Hearing Instruments in Speechmap 85 FM fitting and verif...

Page 5: ...Guide Version 3 4 June 2011 23 References 108 24 Appendix 1 111 Manufacturer Disclosure Statement for Medical Device Security 111 25 Appendix 2 114 AudioNote 2 1 VERIFIT and RM500SL Test Signals and...

Page 6: ...ation level of the lowered components of the speech signal 2 ISTS the International Speech Test Signal has been added in Speechmap 3 German language screen text and setup selection 4 Reset test setup...

Page 7: ...uthorized alteration or repair Trademarks Audioscan RM500SL and Speechmap are registered trademarks of Etymonic Design Inc DSL is a registered trademark of the University of Western Ontario HP LASERJE...

Page 8: ...the following table are met with the Audioscan SL 100 RECD transducer connected The use of other accessories may result in increased emissions Guidance and manufacturer s declaration electromagnetic...

Page 9: ...RM500SL User s Guide Version 3 4 June 2011 EC Declaration of Conformity 9...

Page 10: ...RM500SL User s Guide Version 3 4 June 2011 10...

Page 11: ...nside the test chamber 2 Unwrap the power cord from its stowage hooks noting carefully how it has been packed To avoid serious damage to the display screen always repack the cord this way 3 Connect th...

Page 12: ...twist the cable when attaching a coupler to the coupler microphone Turn only the coupler or unplug the coupler microphone before turning it 2 DO NOT leave the coupler microphone plugged in when transp...

Page 13: ...in a clean area 4 DO stow the probe module when not in use or when transporting the RM500SL Battery pill use and care Battery pills are optional The thin connecting strip of each battery pill is frag...

Page 14: ...ay not work and are not supported by Audioscan Multiple USB devices may be used together by connecting them to the RM500SL USB port via a USB hub In the European Community if this device is connected...

Page 15: ...if this device is connected to one or more other devices to make a system the CE mark on this device is only valid if the other devices in the system carry a CE mark in respect of the Medical Device...

Page 16: ...ypad which may be operated by the mouse Clicking the left mouse button when the mouse pointer is on a graph will display a screen cursor with a digital readout of X and Y co ordinates Clicking again w...

Page 17: ...nned is flat With the scanner 6 8 from the barcode press the trigger on the scanner and center the illuminated red line along the length of the barcode 3 When the scan is successful the scanner will b...

Page 18: ...s state Menus lists and buttons Menu Setup Box List Box Screen Buttons are identified by a circle within a raised block and are located at the right hand end of a line of screen text A screen button h...

Page 19: ...cradle as shown Software updates must be transferred to this USB flash drive in order to be used This requires that the USB flash drive be removed from the RM500SL and plugged into the USB port on a P...

Page 20: ...rive into the USB port with its foam pad down 3 Replace the foam in the floor of the test chamber NOTE that the USB flash drive has been especially configured for the RM500SL Replacing this flash driv...

Page 21: ...rnal display and to any connected external monitor To change display settings 1 Press Setup then highlight and PICK Display 2 To change the screen language highlight and PICK Language to toggle betwee...

Page 22: ...11 To enable disable erasing of test levels stimuli and assessment parameters when Erase data is selected 1 Press Setup then highlight and PICK Save option 2 Highlight and PICK Save test setups on era...

Page 23: ...have a Dynamic Host Configuration Protocol DHCP server For manual addressing the remote computer must be running Windows 95 or higher File and Printer Sharing for Microsoft Networks must be enabled a...

Page 24: ...ne port on a Ethernet network hub or switch Connect a Cat 5 RJ 45 cable from a hub port to the RM500SL connector To set up the PC 1 Right click Network Neighborhood or My Network Places select Propert...

Page 25: ...field or file name identifies the printed or saved data as belonging to an individual it becomes Individually Identifiable Health Information and must be protected under the HIPAA Security Rule See A...

Page 26: ...d to printouts Barcodes representing hearing threshold UCL and RECD where applicable may be added to printouts of Viewport Speechmap Insertion gain and RECD tests Tabular data where applicable may be...

Page 27: ...oard and enter comments Press PICK or Enter on the keyboard number pad to complete the entry To be prompted for new comments for each printout highlight and PICK Ask 10 To be prompted for a new file n...

Page 28: ...us bmp or gif Do not use space or tab in the file name This may create electronic Protected Health Information ePHI See Section overview and Appendix 1 of the User s Guide 7 To save all test data as a...

Page 29: ...rom your network administrator Printing to a network file To save the screen image as a file on a network PC you must first enable networking See Networking You must also share a folder in the PC root...

Page 30: ...and configure file based data exchange 1 Press Setup then highlight and PICK Session 2 Highlight and PICK Enable file based data exchange 3 Highlight and PICK the storage file location USB drive or N...

Page 31: ...e session from file 3 Highlight and PICK the Client ID list button to generate a list of previously entered client identification codes 4 Highlight and PICK a client identification code from the list...

Page 32: ...xcept for Distortion Input Output Battery drain and Manual control screens you have the option of selecting either a graphic or tabular format To change the data format highlight then PICK Graph or Ta...

Page 33: ...SPA frequencies defined by ANSI S3 22 rather than the default High Frequency Average HFA frequencies The choice of SPA or HFA frequencies influences the average OSPL90 average full on gain reference t...

Page 34: ...curve should be similar to one of these and should remain stable over time Irregularities in the calibration curve may be the result of positioning errors See Calibrating test box reference microphone...

Page 35: ...rator on and adjust it to present one of the available frequencies and levels e g 94 dB SPL at 1000 Hz 5 Press Tests then highlight and PICK Test box measures then highlight and PICK Manual control 6...

Page 36: ...or block the sound outlet of the instrument Vents should be sealed at the faceplate end It is very important that the instrument be well sealed to the coupler Open fit instruments must use the couple...

Page 37: ...RM500SL User s Guide Version 3 4 June 2011 37...

Page 38: ...have a HFA or SPA full on gain greater than the HFA or SPA OSPL90 minus 77 dB Otherwise the RTP is full on If required the RM500SL will pause in its testing and guide you in setting the gain control...

Page 39: ...put AGC controls and or programmable parameters should be set as designated by the manufacturer 6 Press Continue to run the test or press Cancel to abort the test Note that if required the Verifit wil...

Page 40: ...e not typical characteristics but indicate the adjustment range possible for these parameters If you are unsure which test sequence to run try AGC first If attack and release times are all near zero t...

Page 41: ...aled and ambient noise is low ANSI telecoil terminology The RM500SL test chamber contains an integrated telephone magnetic field simulator TMFS meeting the requirements of ANSI S3 22 that enable the m...

Page 42: ...mber surface while custom aids should be oriented with their faceplate parallel to the top surface if possible and touching it as shown 6 Press Continue to start the test 7 While maintaining the orien...

Page 43: ...RM500SL User s Guide Version 3 4 June 2011 telecoil test 43...

Page 44: ...This test measures harmonic distortion at 2nd or 3rd harmonics with input levels varying from 60 90 dB SPL It also presents the sum of 2nd and 3rd harmonics as total harmonic distortion THD For heari...

Page 45: ...nstrument for testing 3 Turn the instrument ON 4 Highlight and PICK button 1 2 3 or 4 in the Test column 5 Highlight and PICK the Stimulus window then highlight and PICK either Pink noise or Swept fro...

Page 46: ...ue causes the swept filter analysis to be performed in 1 12th octave bands and displayed at 1 12th octave frequencies Battery drain test The battery drain test automatically measures the battery curre...

Page 47: ...then highlight and PICK the desired stimulus level from the drop down list 3 Highlight and PICK the Frequency window then highlight and PICK the desired frequency from the drop down list Distortion m...

Page 48: ...PICK the Level window then highlight and PICK 0 dB stimulus level from the drop down list 3 Highlight and PICK the Filter window then highlight and PICK 1 12th octave A weighted or C weighted from the...

Page 49: ...L User s Guide Version 3 4 June 2011 NOTE A microphone extension cable VA 130 is available from Audioscan Standard audio extension cables should not be used They will substantially increase noise leve...

Page 50: ...any cochlear hearing loss For comparison purposes a simulation of a purely conductive loss is also provided To properly experience the simulation listeners should be within 1m of the sound field speak...

Page 51: ...RM500SL User s Guide Version 3 4 June 2011 51...

Page 52: ...with the flat factory calibrated response of the on ear reference microphone and compensates all subsequent probe tube measurements for this difference It may be performed as often as desired but wil...

Page 53: ...for the second probe module 7 To change the calibration interval highlight PICK Daily or Weekly Calibration check for probe module The calibration curve for the probe module is a comparison of the re...

Page 54: ...ut 18 0 5 m in front of the sound field speakers 6 Hold the microphone of a calibrated sound level meter next to the on ear reference microphone as shown Set the sound level meter to C weighting and s...

Page 55: ...ative to the average stimulus pe SPL at ABR threshold of a normal hearing jury OR b stimulus SPL at ABR threshold relative to the average stimulus SPL at behavioral threshold of a normal hearing jury...

Page 56: ...e Set the black marker ring approximately 28 mm from end of probe tube for adult females approximately 30 mm from end of probe tube for adult males and approximately 20 25 mm from end of probe tube fo...

Page 57: ...RM500SL User s Guide Version 3 4 June 2011 57...

Page 58: ...been selected only 2cc OSPL90 values are indicated Target gains are for speech like signals at a 70 dB input SPL OSPL90 targets are for 90 dB pure tones On ear targets are converted to 2cc coupler va...

Page 59: ...ht and PICK Scale to toggle between a dB SPL and dB HL scale Hide or show on ear curves On screens capable of showing a speech envelope you may show or hide the speech envelope for clarity of display...

Page 60: ...d set the Stimulus to Speech std 1 or 2 and the level to 50 or 60 dB SPL As the speech passage plays observe the feedback bar and the lower graph A yellow Feedback bar and peaks with yellow markers in...

Page 61: ...Tests then highlight and PICK On ear measures then highlight and PICK Manual control 3 Highlight and PICK the Level window then highlight and PICK the desired stimulus level from the drop down list 4...

Page 62: ...proper positioning of the client and the probe tube 2 Press Tests then highlight and PICK On ear measures then highlight and PICK Manual control 3 Highlight and PICK the Level window then highlight an...

Page 63: ...asurement is useful in quantifying the extent to which venting or deep insertion is addressing the underlying cause of the complaint Occlusion effect measurement 1 Refer to On Ear Measures Setup to pr...

Page 64: ...RM500SL User s Guide Version 3 4 June 2011 64...

Page 65: ...use 2cc coupler targets you should use measured or age related RECD Insert phone audiometry with measured RECD and on ear verification provides the best fitting accuracy with test box verification be...

Page 66: ...rve green When this curve is stable press Continue to save it 6 Highlight and PICK Daily or Weekly to toggle the measurement interval for the coupler response For comparison purposes an age related av...

Page 67: ...response exists highlight and PICK Measure real ear 3 Refer to Positioning the probe tube and insert the probe tube into the ear canal to within 2 5 mm of the eardrum 4 Insert the foam tip into the ea...

Page 68: ...them For comparison purposes an age related average RECD is shown as a dotted curve on the screen If you have accessed RECD from the on ear tests list you may highlight and PICK the Age box to change...

Page 69: ...linear and non linear hearing instruments Refer to On Ear Measures Setup and On Ear Measures Screen Setup for terminology and information on preparing the system for use and for proper positioning of...

Page 70: ...ted aided threshold curve is calculated by shifting the unaided threshold curve upward by the REIG This estimate assumes a the unaided threshold is a sound field threshold and b a linear aid i e REIG...

Page 71: ...sing a mouse or keypad Left click the mouse on the audiogram form to enter a point Click again to delete the point On the keypad use the arrow keys to change frequency and level and press PICK to ente...

Page 72: ...re 1 Press Tests then highlight and PICK On ear measures then highlight and PICK Insertion gain 2 Referring to On Ear Measures Setup and On Ear Measures Screen Setup prepare the system position the pa...

Page 73: ...t 70 dB SPL REUR the target REIG and for each aided test The calculations use the 1 3 octave band method of ANSI S3 5 1997 without the 160 Hz band and without masking effects with results expressed as...

Page 74: ...RM500SL User s Guide Version 3 4 June 2011 SII Score 10 1 15 8 20 20 25 45 30 60 35 74 40 84 45 90 50 94 55 96 60 98 70 99 80 100 90 100 74...

Page 75: ...g is signal dependent It also makes provision to correct audiometric data and 2cc coupler measurements for age related or individually measured acoustic differences between real ears and the couplers...

Page 76: ...The differences will be more significant when the individual RECD values have not been measured for the child being fitted Audioscan assumes no responsibility for the validity of these changes that re...

Page 77: ...e speech passage and the curves are then calculated for the entire passage producing an accurate display of the speech region and LTASS and an accurate SII calculation When using live speech a Freeze...

Page 78: ...RM500SL User s Guide Version 3 4 June 2011 Screen tour unaided screen 78...

Page 79: ...ophone is modified to include average microphone location effects for the hearing instrument type indicated The screen display for both modes is the same showing SPL measured or simulated in the ear c...

Page 80: ...s a by multiplying by 100 Level distortion effects are included but no hearing loss desensitization is applied An idealized speech region of LTASS 15 dB is used The speech recognition associated with...

Page 81: ...nput and 1 Press the barcode trigger and center the red line on the barcode from a distance of 6 8 The scanner will beep and the Barcode Entry poster opens 2 Highlight and PICK Done to accept the data...

Page 82: ...med for sound delivery and the appropriate RECD will be applied Note that in some facilities nHL is defined in such a way that it is effectively eHL in these cases ABR eHL should be selected See ABR n...

Page 83: ...nd set stimulus to Speech std 1 or Speech std 2 and level to 50 Elongated symbols show the target range for 50 dB speech LTASS 3 Adjust frequency shaping and gain for soft sounds so that the middle cu...

Page 84: ...for mid level speech 6 Select Test 3 and set stimulus to Speech std 1 or Speech std 2 and level to 70 Elongated symbols show the target range for 70 dB speech LTASS 7 Adjust gain for mid level sounds...

Page 85: ...evel speech Verifying Frequency Compression Frequency Lowering Hearing Instruments in Speechmap Frequency lowering is used when it is not possible to amplify the high frequency components of speech su...

Page 86: ...earing aid has no gain at the selected band frequency This does not mean that the hearing aid will be unable to transpose the band to a lower frequency when frequency lowering is enabled 6 Program the...

Page 87: ...rom the Test box measures menu Select the appropriate hearing Instrument type typically BTE 2 Highlight and Pick Test 1 and choose Speech std 1 or 2 at a Level of 65 dB Press Continue to run and recor...

Page 88: ...gs in Speechmap based on draft AAA Clinical Practice Guidelines 2007 Open fittings must be verified in On ear mode 1 Enter Audiometry data and select FM from the Instrument list box 2 Position the tra...

Page 89: ...ovided by frequency lowering hearing aids and the sensation level of the lowered components of the speech signal The ICRA noise female and child speech signals are presented as recorded with no spectr...

Page 90: ...voice spectrum is from Cornelisse et al 1991 adjusted to a 1 m reference 1 3 octave band SPL Add to band SPL for Speech Hz Standar d ISTS Female Child ICRA Noise Pink Noise Loud Own Voice FM Chest FM...

Page 91: ...5 41 3 43 5 32 6 33 5 53 4 2 0 0 11 4 26 2 8000 41 5 40 4 39 9 35 2 28 2 53 2 7 4 0 11 0 25 8 Overall 65 0 65 0 65 0 65 0 65 0 65 75 0 75 0 84 0 93 0 Microphone location effects Microphone Location Ef...

Page 92: ...he samples called L1 or 99th percentile has historically been referred to as the speech peak for that band The curve of the 99th percentile is approximately 12 dB above the LTASS The level in each ban...

Page 93: ...CK Self test 2 If you received a Max out in or a Routing failure remove any hearing aids from the test chamber unplug the monitor headphones if used and rerun self test 3 Unplug all microphones On ear...

Page 94: ...aring instrument s microphone without actually touching it The noise or feedback reduction features are attempting to reject the test signal These need to be disabled prior to tests with tones or nois...

Page 95: ...ay be displayed during the test box calibration procedure It indicates that the calibration curve is significantly different from what is expected It may be accompanied by a missing test box reference...

Page 96: ...irectional test is being attempted See External sound field speaker setup The test environment is too reverberant for the distance between the client and the speaker s Move the on ear speaker s intern...

Page 97: ...RM500SL User s Guide Version 3 4 June 2011 97...

Page 98: ...RM500SL User s Guide Version 3 4 June 2011 98...

Page 99: ...RM500SL User s Guide Version 3 4 June 2011 99...

Page 100: ...speech Test stimulus levels 40 to 90 dB SPL in 5 dB steps Test stimulus levels inductive 31 6mA m per ANSI S3 22 2003 Test stimulus distortion 2 at 90dB SPL 0 5 at 70 dB SPL Test stimulus accuracy at...

Page 101: ...dB 200 5000 Hz 2 5 dB 5000 8000Hz Measurement Range 20 135 dB SPL 200 2500 Hz 30 140 dB SPL 2500 8000Hz ANSI S3 46 1997 tests available Real Ear Unaided Response Real Ear Aided Response Real Ear Occl...

Page 102: ...RM500SL User s Guide Version 3 4 June 2011 102...

Page 103: ...which the microphone is at the ear opposite to the one receiving the amplified sound CORFIG coupler response for flat insertion gain the transformation added to real ear insertion gain to obtain 2 cc...

Page 104: ...onent fundamental Harmonic Distortion the addition of harmonic components to a signal The rms value of a harmonic component of a signal as a percentage of the rms value of the fundamental If less than...

Page 105: ...input SPL The SPL developed in a 2cc coupler when the input SPL is 90 dB with the gain control of the hearing aid full on ANSI S3 22 Oscillation in audiology refers to the undesired tonal output of an...

Page 106: ...ear canal for a specified sound field with the ear canal unoccluded ANSI S3 46 Reference microphone microphone used to measure the stimulus level in the measurement process or to control it in the equ...

Page 107: ...f less than 20 the power of the total signal may be used instead of the fundamental For most hearing aids the inclusion of harmonics above the third will not significantly alter the THD ANSI S3 22 Tra...

Page 108: ...mmunication Journal of Audio Engineering Society 38 9 640 652 Cornelisse L E Gagne J P Seewald R C 1991 Ear level recordings of the long term average spectrum of speech Ear and Hearing 12 1 47 54 Corn...

Page 109: ...ll S 1977 Speech levels in various noise environments Project Report On Contract 68 01 2466 Washington DC US Environmental Protection Agency Platz Rainer 2004 SNR Advantage FM Advantage and FM Fitting...

Page 110: ...ctions of normal hearing and hearing impaired listeners performance on the Connected Speech Test Ear and Hearing 24 1 71 88 Sinclair S T Moodie K S Seewald R C 1997 Pediatric Hearing Instrument Fittin...

Page 111: ...RM500SL User s Guide Version 3 4 June 2011 24 Appendix 1 Manufacturer Disclosure Statement for Medical Device Security 111...

Page 112: ...RM500SL User s Guide Version 3 4 June 2011 112...

Page 113: ...RM500SL User s Guide Version 3 4 June 2011 113...

Page 114: ...500SL User s Guide Version 3 4 June 2011 25 Appendix 2 AudioNote 2 1 VERIFIT and RM500SL Test Signals and Analysis For additional details of the signals and their analysis see the appended AudioNote 1...

Page 115: ...played from 16 bit binary audio files stored in the on board flash memo ry In the Verifit these audio files are up loaded from the internal compact disc CD drive at power up In order to provide a repe...

Page 116: ...re frequency modulated triangle 3 over 128 ms 2 2 Broad band signals 2 2 1 Pink Noise signal The pink noise signal is available for Multicurve 2 cm3 coupler gain and output frequency response mea sure...

Page 117: ...tly controlled with 1 12 octave resolution at the reference microphone Two simultaneous re sponse curves one for each speaker are derived from the measured output of the hearing aid This provides a re...

Page 118: ...the Speech std 1 passage at that level These three signals may be used to deter mine the amount of frequency shift provided by fre quency lowering hearing aids and the sensation level of the lowered c...

Page 119: ...Figure 6 Note that curves are 1 3 octave band levels at 1 12 octave intervals which causes the 1 3 octave bands at 4000 5000 and 6300 Hz to appear broader than 1 3 octave For clarity the Speech3150 c...

Page 120: ...nd levels for an overall SPL of 65 dB This shaping is applied to the 75 dB SPL speech and ICRA signals Figure 6 Microphone location effects in dB re nominal band SPL Nominal band levels are band level...

Page 121: ...de is in 1 3 octave bands Other analyzers use narrower analysis bands sometimes having constant bandwidth As shown in Figure 7 this can result in significantly underestimat ing the audibility or comfo...

Page 122: ...signal For example a 1 3 octave band of speech will exhibit a spectrum 2 3 octave wide The dynamic nature of speech is often characterized by the distribution of short term levels in each 1 3 octave...

Page 123: ...ble repeatable result However the effects of adjustments to hearing aid pa rameters need to be seen quickly in order to be useful for optimization To resolve these conflicting needs speech signals are...

Page 124: ...9th percentile is at threshold Figure 11 When LTASS is at threshold SII 33 which corresponds approximately to SRT 09 01 29 Etymonic Design Incorporated 41 Byron Ave Dorchester ON Canada N0L 1G0 USA 80...

Page 125: ...nvelope is above threshold Figure 13 Level of 99th percentile for Speechmap speech signals at average vocal effort 09 01 29 Etymonic Design Incorporated 41 Byron Ave Dorchester ON Canada N0L 1G0 USA 8...

Page 126: ...signals at average vocal effort Figure 15 Dynamic range of Verifit speech signals at average vocal effort 09 01 29 Etymonic Design Incorporated 41 Byron Ave Dorchester ON Canada N0L 1G0 USA 800 265 2...

Reviews: