30
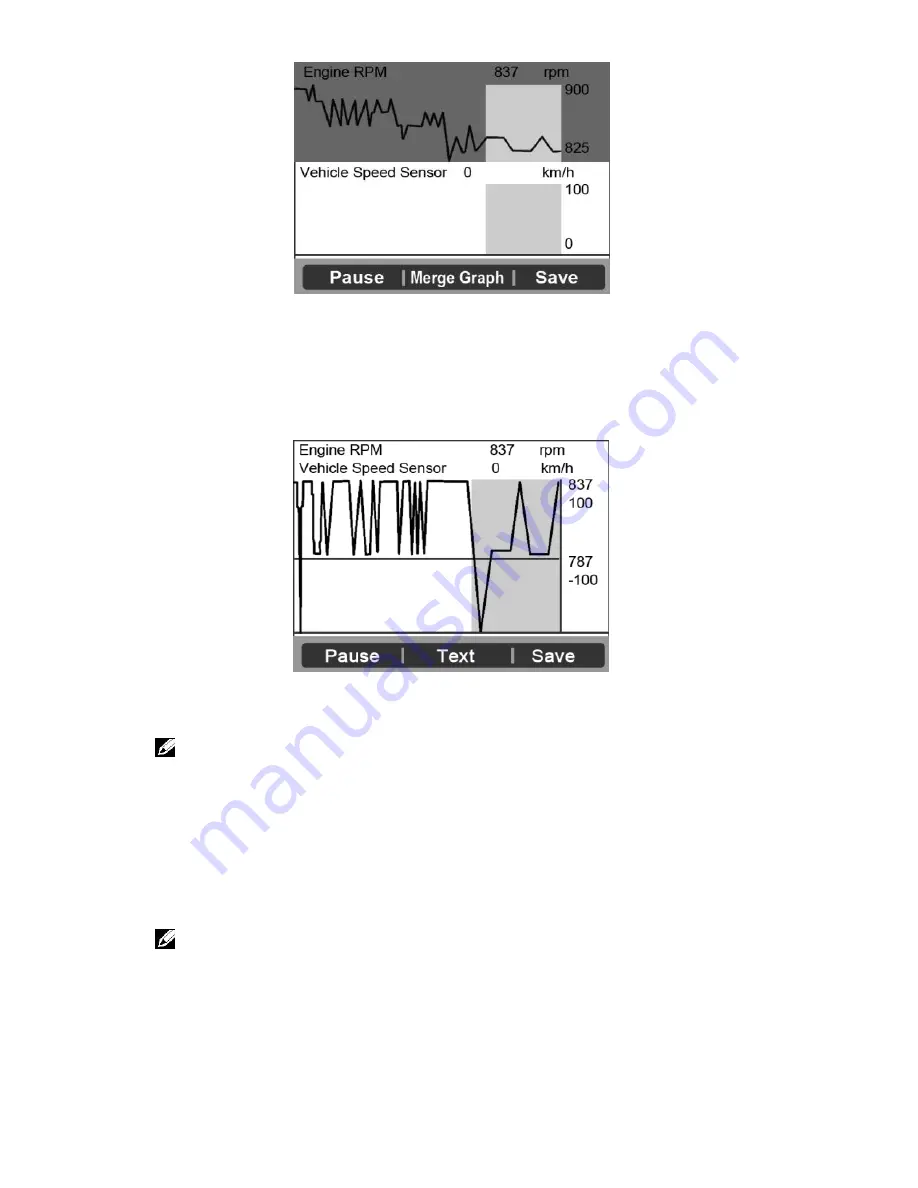
Figure 5.28
5)
Press the function button corresponding to
Merge Graph
, the
above two graphs will merge together.
Figure 5.29
NOTE
:
Merge Graph
can be used to compare two related
parameters in graphic mode. It is especially convenient that you
could select two interacted parameters to merge and see their
relationship.
6)
Select
Text
to return to view the live data in text form
7)
Select
Save
to record retrieved live data and graphs.
NOTE
: The scan tool can only playback text data even though
the data is saved in graphic mode. Since what you are viewing
is “real time” Live Data, the data changes as the vehicle’s
operating conditions change.


