31
b) Buzzer Alarm
— switches the alarm on and off. The alarm function makes
a beeping sound to alert you when the data reading reaches the preset
minimum or maximum values. The buzzer alarm will only sound at the first
trigger.
c) MIN
— tap this input box to display a virtual keyboard to enter the required
lower threshold value.
d) MAX
— tap this input box to display a virtual keyboard to enter the required
upper threshold value.
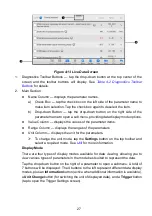
To set a trigger
1. Tap the drop-down button on the right of a parameter to open a submenu.
2. Tap the
Trigger
button on the right side of the submenu to open the Trigger
Settings screen.
3. Tap the
MIN
input box and enter the required minimum value.
4. Tap the
MAX
input box and enter the required maximum value.
5. Tap
OK
to save the settings and return to the Live Data screen, or tap
Cancel
to exit without saving.
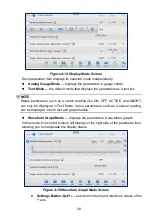
When the trigger is set, a trigger mark will appear in front of the parameter. The mark is
gray when it is not triggered, and displays orange when triggered. Moreover, two
horizontal lines display on each of the data graphs (when Waveform Graph Mode is
applied) to indicate the alarm point. The threshold lines are shown in different colors to
differentiate them from the parameter waveforms.
Function Buttons
The operations of available function buttons on the Live Data screen are described below:
Cancel All
— tap to cancel all selected parameters. Up to 50 parameters can be
selected at one time.
Show Selected/Show All
— tap to switch between the two options. One displays
the selected parameters, the other displays all available items.
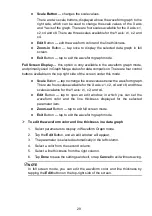
Graph Merge
— tap to merge selected data graphs (for Waveform Graph Mode
only). This function is very useful when comparing different parameters.
NOTE
This mode supports the merging of 2 to 5 parameters from different graphs. Only
quantitative parameters are supported.
To merge selected data graphs
1.
Select parameters to be merged.
2.
Tap the
Graph Merge
button at the bottom of the Live Data screen.

