IFD500 Series Pilot Guide
4-58 Map Subsystem
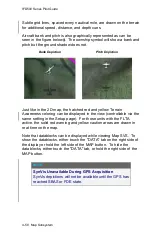
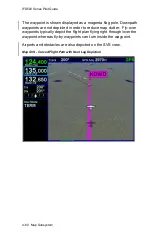
Subtle grid lines, spaced every nautical mile, are drawn on the terrain
for additional speed, distance, and depth cues.
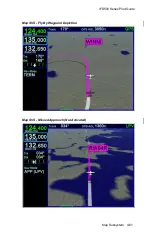
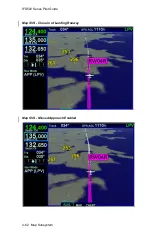
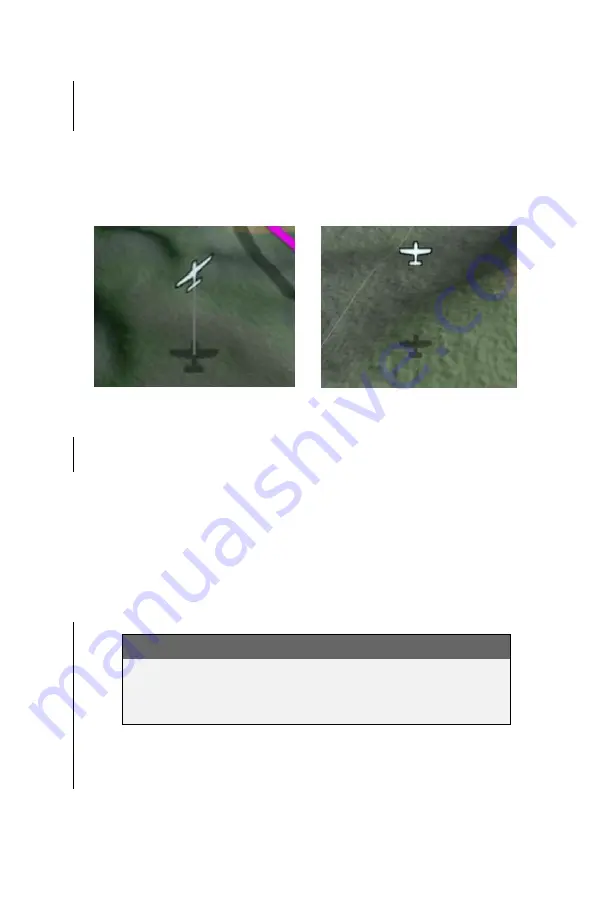
Aircraft bank and pitch is also graphically represented as can be
seen in the figure below
‡
. The ownship symbol will show a bank and
pitch but the ground shadow does not.
Bank Depiction
Pitch Depiction
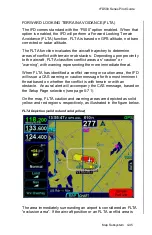
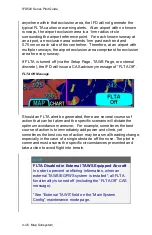
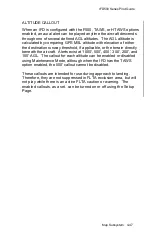
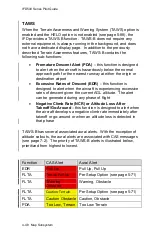
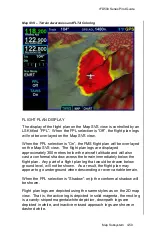
Just like in the 2D map, the hatched red and yellow Terrain
Awareness coloring can be displayed in the view (controllable via the
same setting in the Setup page). For those units with the FLTA
active, the solid red warning and yellow caution areas are drawn in
real-time on the map.
Note that datablocks can be displayed while viewing Map SVS. To
show the datablocks, either touch the "DATA" tab on the right side of
the display or hold the left side of the MAP button. To hide the
datablocks, either touch the "DATA" tab, or hold the right side of the
MAP button.
NOTE
SynVis Unavailable During GPS Acquisition
SynVis depictions will not be available until the GPS has
reached SBAS or FDE state.
Summary of Contents for IFD510
Page 1: ......
Page 140: ...IFD500 Series Pilot Guide 3 50 FMS Subsystem Weather Data on Info Tab Info Tab Nearby Navaids ...
Page 150: ...IFD500 Series Pilot Guide 3 60 FMS Subsystem User Waypoint Airfield Naming Example ...
Page 156: ......
Page 180: ...IFD500 Series Pilot Guide 4 24 Map Subsystem ADS B Lightning Coverage Area Shadow ...
Page 252: ...IFD500 Series Pilot Guide 5 16 Aux Subsystem Trip Statistics Calculator ...
Page 460: ...IFD500 Series Pilot Guide 7 82 General Bluetooth pairing pairing code ...

