STATISTICS
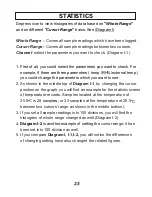
Depress icon to view histograms of data based on
"
Whole Range
"
and on different
"
Cursor Range
"
basis. See (Diagram I)
Whole Range -
C
overs all sample readings which have been logged.
Cursor Range -
C
overs all sample readings between two cursors.
Channel
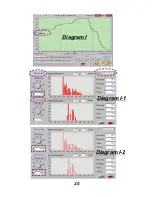
- select the parameters you want to check. (Diagram I-1)
25
1. First of all, you could select the parameters you want to check. For
example, if there are three parameters ( temp./RH%/external temp.)
you could change the parameters which you want to see.
.
Diagram I-2
is another example of setting the
2. As shown in the middle top of
Diagram I-1
, by changing the cursor
position on the graph, you will find an example for the statistic screen
of temperature records. Samples located at the temperature of
o
o
25.8 C is 28 sampl
es,
or 33 samples at the temperature of 25.5
C
between two cursors' range as shown in the middle bottom).
3. If you set all sample readings into 100 divisions, you will find the
histogram of whole range changed as well.(Diagram I-2)
4
cursor range; it has
been set into 100 division as well.
5. If you compare
Diagram I, I-1,I-2,
you will notice the differences
of changing setting have also changed the related figures.


