background image

INSTRUCTION MANUAL


LogBox RHT 

Temperature and Humidity Data Logger 


Technical changes reserved


B+B Thermo-Technik GmbH | Heinrich-Hertz-Str. 4 | D-78166 Donaueschingen 

0141 0315-14    07.06.2016


Fon +49 771 83160 | Fax +49 771 831650 | info@bb-sensors.com | bb-sensors.com 

5 / 18 


6.3.


Identification 

The identification label is on the logger body. Check if the features described are in accordance with your order. 
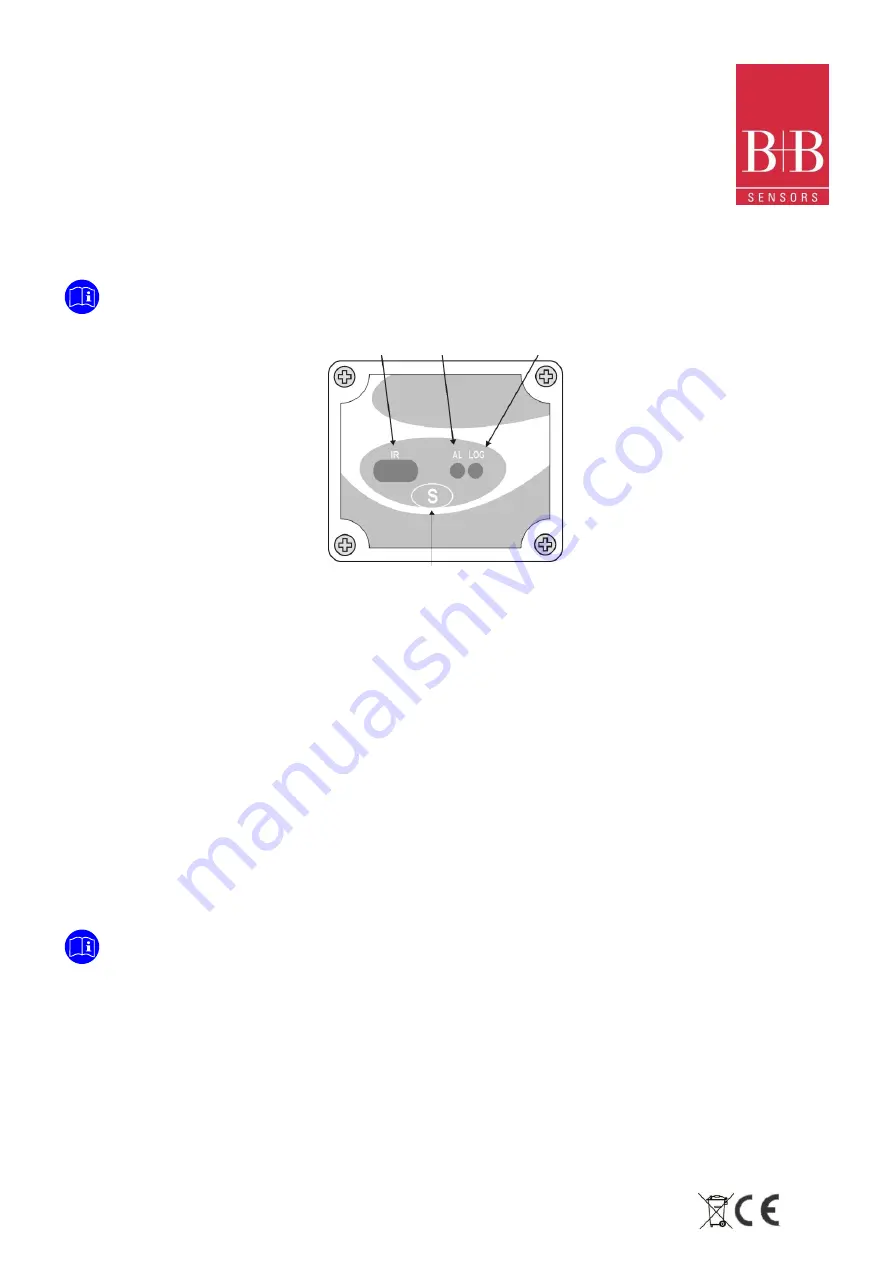
The following elements are shown in the logger front. 


Start/stop button (S) 

This  button  can  be  configured  to  start  or  stop  the  temperature  measurement 

process.


IR communication Window 

PC - Logger communication area. During download, the communication interface 

must be directed towards this window.


Status indicator (LOG) 

While in stand-by (not logging) or after a series of measurements, it flashes once 

at every four seconds. During logging it flashes twice at every four seconds.


Alarm Indicator (AL) 

Warns the user as to alarm conditions. Whenever an alarm situation takes place 

it will flash once at every four seconds, until a new configuration is applied to the 
logger. 

7.


OPERATION 

 
It  is  only  possible  to  operate  the  logger  after  the  Logchart-II  software  is  installed  to  a  PC,  according  to  the  steps  described  in 

Logchart-II Software 

section of this manual. The communication between logger and PC is performed with the aid of the 

IR-Link 

wand

Requirements: 


A PC system or a Laptop with Windows

®

 2000- or XP 


CD-ROM device 


A free USB interface 

The logger must be “woken up” before communication is attempted. To do so, press the 

Start/Stop 

button.  

The logger starts flashing the 

Status Indicator

 according to its current status: 

One 

flash  every  four  seconds  (stand-by)  indicates  the  logger  is  waiting  to  start  measuring  or  that  a  series  of  measures  was 

concluded and the logger is waiting for a new command. 

Two

 flashes every four seconds indicate measures ongoing. 

The logger operation mode set up is defined in advance by using the 

LogChart-II 

software

.

 Each setting must be defined and the 

consequences observed. The logger starts and stops logging as defined in settings. 


Communication 

interface 

Alarm 

Status 

indicator 

Start/Stop Button 


Summary of Contents for LogBox RHT

Page 1: ... Temperature and Humidity Data Logger Technical changes reserved B B Thermo Technik GmbH Heinrich Hertz Str 4 D 78166 Donaueschingen 0141 0315 14 07 06 2016 Fon 49 771 83160 Fax 49 771 831650 info bb sensors com bb sensors com 1 18 ...

Page 2: ...ION 4 6 1 Supply voltage 4 6 2 Unpacking 4 6 3 Identification 5 7 OPERATION 5 7 1 Drivers and software installation 6 7 2 Running LogChart_II 7 7 3 Configuring the logger 7 8 DATATRANSFER AND VISUALISATION 10 8 1 Offloading data 10 8 2 Visualizing data 10 8 3 Chart view 10 8 4 Sheet view 10 8 5 General information sheet 11 8 6 Exporting data 11 9 PDA USER 12 9 1 Accessing the Logger 12 9 2 Configu...

Page 3: ... paid in attention to assure a highly effective and secure use of the supplied product Please read through the following instructions and make yourself familiar with the handling of the product before you insert it in your processes Keep this document always readily to hand so you can consult it by need 2 1 Labels Darstellung Bedeutung Hinweis Advice It is necessary to read the following advices b...

Page 4: ...me 5 USAGE ACCORDING TO PURPOSE Please use the product only for the purposes for which it is conceived In case of doubt please first contact B B Thermo Technik GmbH 6 PRODUCT DESCRIPTION LogBox RHT is a small portable electronic temperature and humidity logger Its internal sensor measures local environment temperature humidity and logs the values in an electronic memory Logged data or ACQUISITIONS...

Page 5: ...s place it will flash once at every four seconds until a new configuration is applied to the logger 7 OPERATION It is only possible to operate the logger after the Logchart II software is installed to a PC according to the steps described in Logchart II Software section of this manual The communication between logger and PC is performed with the aid of the IR Link wand Requirements A PC system or ...

Page 6: ...t this time and then click Next 4 Select Install from a list or specific location Advanced and click Next 5 Select Search for the best driver in these locations and check Search removable media Click Next If installation files are not in a CD check Include this location in the search and show the file path 6 If a prompt warns you that it does not support Windows XP or that signature verification f...

Page 7: ...Ir Link3 USB choose USB port The chosen port will be chosen by default next times the LogChart II is initiated When a valid port is selected the icons below are highlighted 7 3 Configuring the logger Make sure the communication interface is connected to the PC port selected The interface must be constantly directed towards the communication window on front part of the logger at a maximum distance ...

Page 8: ... minimum interval is 1 one second and the maximum is 18 eighteen hours Note When the type of value logged is Average Maximum or Minimum values see Value the minimum interval is 10 seconds Daily Operations Here the user defines the time at which daily logs will take place Estimated time In this field the logger informs the user how long it will take to occupy the full memory in the conditions set u...

Page 9: ...od and save the measured value in the internal memory The minimum interval between measurements is 1 seconds Average The Logger takes 10 equidistant measurements within the predefined measurement interval Period build the average of these ten values and store the result in the internal memory The minimum interval between measurements is 10 seconds Maximum The Logger takes 10 equidistant measuremen...

Page 10: ...ar indicates remaining data to be transferred Data offloading time is proportional to the number of readings logged 40 Seconds for 16 000 values 8 2 Visualizing data At the end of values transfer data are automatically displayed in a graphical form 8 3 Chart view It is possible to select a region of the chart to zoom in Zoom commands can be accessed through the View menu or through zoom icons from...

Page 11: ...nfo bb sensors com bb sensors com 11 18 8 5 General information sheet This window shows some information about the logger whose data were just read and its configuration The screen can be displayed by pressing the Parameter Viewing icon 8 6 Exporting data Logged data can be exported to different file formats for further analysis To export access File Export or click the icon and store open the dat...

Page 12: ...PDA home screen Starting the LogChart PalmOS application will display the Recorded Data on the PDA screen where it is possible to access the logger to change settings and offload data as well as to access recorded data 9 1 Accessing the Logger To have communication between the logger and the PDA established the user must align the PDA infrared wand to the logger communication window run the LogCha...

Page 13: ...ion is sent to the logger date time Start in defined data and time always after current time It is possible to perform daily repetitions If this option is selected a new box to define the stop logging time is displayed Start Button Press the Start_Now button from the Monitoring screen to start logging The PDA must be turned towards the logger Set point value Measurements start when a temperature s...

Page 14: ...he Logger takes 10 equidistant measurements within the predefined measurement interval Period build the average of these ten values and store the result in the internal memory The minimum interval between measurements is 10 seconds Minimum The value logged will be the minimum value found within ten consecutives measurements taken within an interval The minimum interval between measurements is 10 s...

Page 15: ...t interfere in the ongoing acquisition process The data base of loggings is displayed in the Recorded Data screen identified with the name assigned to the process Data Title and the date it was downloaded Should the PDA batteries be discharged all readings will be lost 9 4 File Visualisation The Recorded Data screen lists the data base logged and stored in the PDA To access data select the desired...

Page 16: ...top LogChart Palm OS files are transferred to the Desktop Choose a directory to record files generated during data synchronization Leave Data on Palm Option to keep or delete the data in the PDA after HotSync Do nothing Data synchronization will not be performed Set as default The same settings will be used in the next HotSync 10 MOST FREQUENTLY FOUND PROBLEMS The LED is not flashing The LED flash...

Page 17: ...771 83160 Fax 49 771 831650 info bb sensors com bb sensors com 17 18 12 QUESTIONS If you still have other questions concerning this or other product of B B Thermo Technik GmbH contact us at B B Thermo Technik GmbH Heinrich Hertz Straße 4 78166 Donaueschingen Phone 49 771 83160 Fax 49 771 831650 E Mail info bb sensors com www bb sensors com Your partner for temperature B B Thermo Technik GmbH ...

Page 18: ...ing to the number of logs 40 seconds for 16 000 logs PC Interface Ir USB or Ir Serial LogChart ll Software Umgebung Windows 95 98 NT 2000 and XP Menus in Portugiesisch English oder Spanisch Einstellungen Datentransfer und Anzeige auf dem Bildschirm 0568 0038 Data Logger LogBox RHT with internal temperature Pt100 and humidity sensors Up to 32 000 values memory capacity Operating Temperature 40 C 80...

Reviews: