


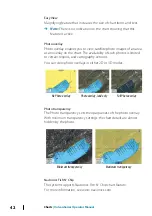


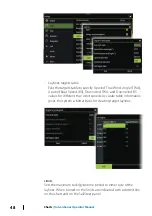

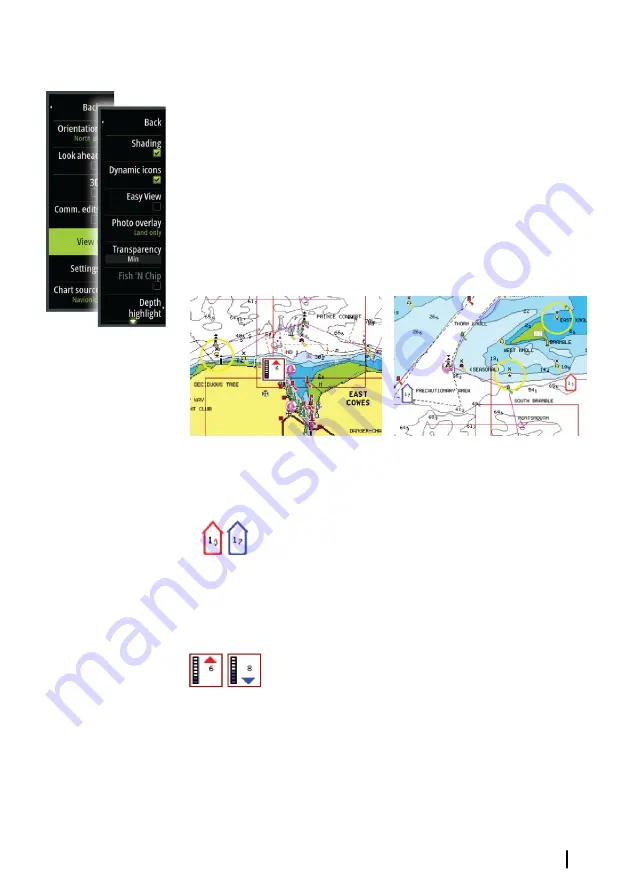
Navionics view options
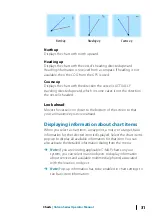
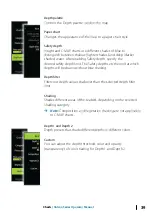
Chart shading
Shading adds terrain information to the chart.
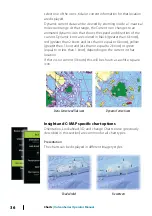
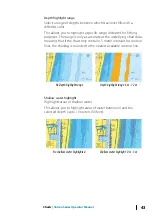
Navionics dynamic tide and current icons
Shows tides and currents with a gauge and an arrow instead of the
diamond icons used for static tides and current information.
The tide and current data available in Navionics charts are related to
a specific date and time. The system animates the arrows and/or
gauges to show the tides and currents evolution over time.
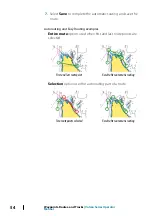
Dynamic tide information
Dynamic current information
The following icons and symbology are used:
Current speed
The arrow length depends on the rate, and the
symbol is rotated according to flow direction. Flow
rate is shown inside the arrow symbol. The red
symbol is used when current speed is increasing,
and the blue symbol is used when current speed is
decreasing.
Tide height
The gauge has 8 labels and is set according to
absolute max/min value of the evaluated day. The
red arrow is used when tide is rising, and the blue
arrow is used when tide is falling.
Ú
Note:
All numeric values are shown in the relevant system units
(unit of measurement) set by user.
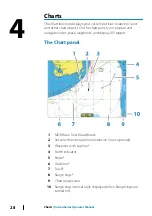
Charts
| Vulcan Series Operator Manual
41
Summary of Contents for Vulcan Series
Page 1: ...ENGLISH VulcanSeries Operator Manual www bandg com...
Page 2: ......
Page 8: ...8 Preface Vulcan Series Operator Manual...
Page 178: ...178 Alarms Vulcan Series Operator Manual...
Page 198: ...988 11111 002 0980...