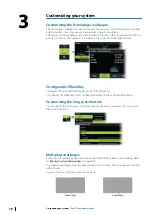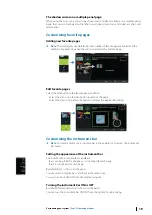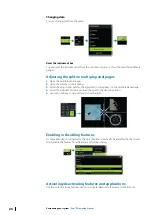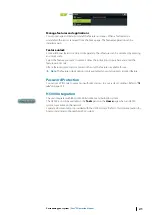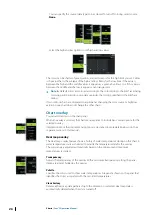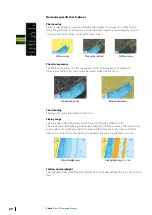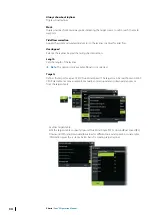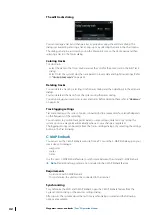
Minimum transparency
Transparency at 80
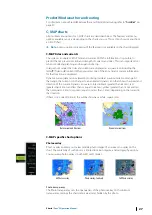
Raster charts
Changes the view to that of a traditional paper chart.
Raster transparency
Controls the transparency of raster imagery.
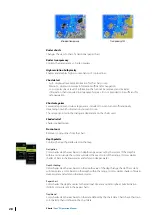
High resolution bathymetry
Enables and disables higher concentration of contour lines.
Chart detail
•
Full - displays all available information for the chart in use.
•
Medium - displays minimum information sufficient for navigation.
•
Low - displays basic level of information that cannot be removed, and includes
information that is required in all geographic areas. It is not intended to be sufficient for
safe navigation.
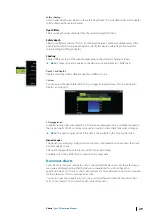
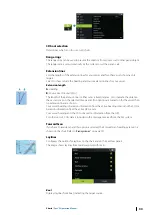
Chart categories
Several categories and sub-categories are included. You can turn on/off individually
depending on which information you want to see.
The categories listed in the dialog are dependent on the charts used.
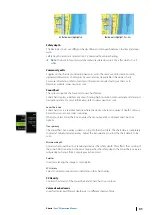
Shaded relief
Shades seabed terrain.
No contours
Removes contour lines from the chart.
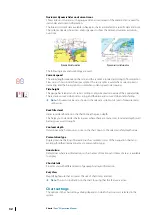
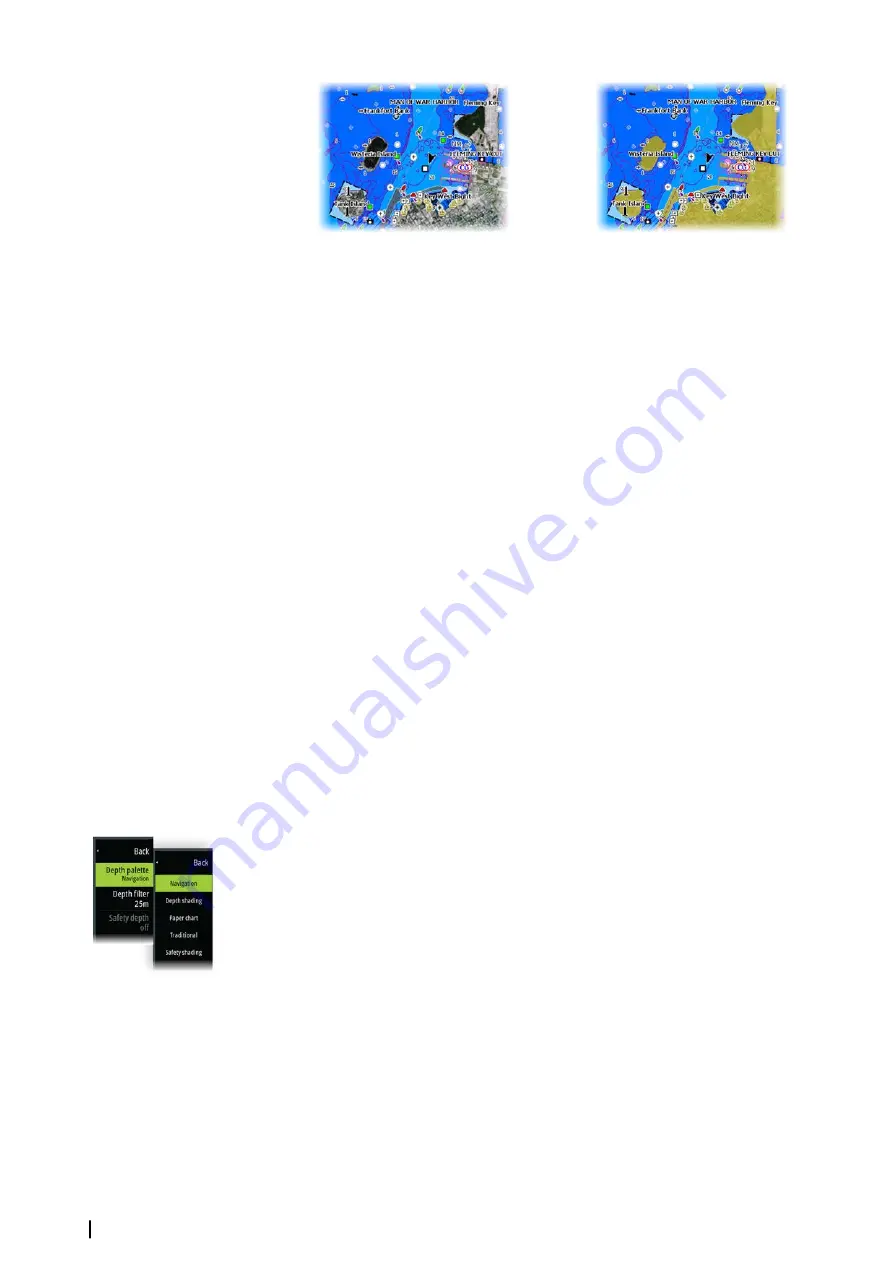
Depth palette
Controls the Depth palette used on the map.
Navigation
Color shades depth areas based on depth range values set by the system. If the depth is
within a certain range the system will select the exact color of that range. It colors darker
shades of blue in shallower water and whiter in deeper water.
Depth shading
Color shades depth areas based on the depth value of the depth range shade. The system
will interpolate a color based on the depth within the range. It colors darker shades of blue in
deeper water and whiter in shallower water.
Paper chart
Color shades the depths similar to the National Oceanic and Atmospheric Administration
(NOAA) colors present in the paper charts.
Traditional
Color shades depth areas based on the data defined by the chart data. Charts have their own
color palette that is defined in the chart data.
28
Charts
| Zeus³S Operation Manual
Summary of Contents for Zeus3S
Page 1: ...ENGLISH Zeus3 S Operator Manual www bandg com...
Page 2: ......
Page 139: ......
Page 140: ...988 12586 001...

