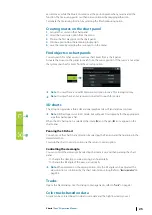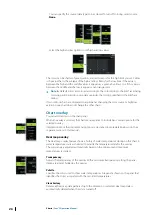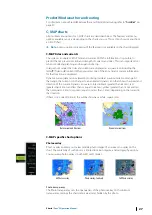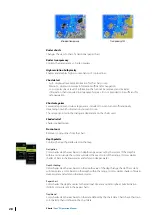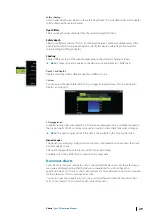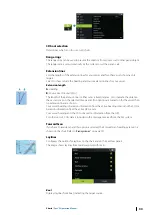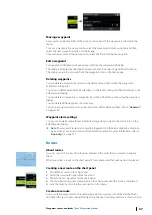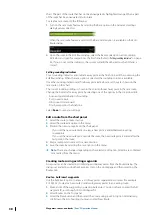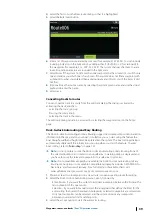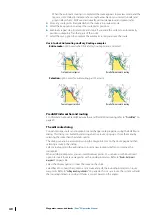
Limits
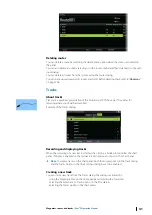
Gives a useful overview of historic layline data. Dotted lines either side of the layline show
how far each way the wind has shifted over the selected time period, to allow you to identify
wind shift phases and judge when to tack accordingly.
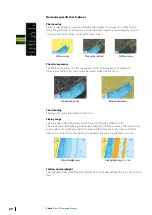
SailSteer overlay
Turns on/off viewing of SailSteer image overlay on the chart. Refer to
"SailSteer overlay"
on page
49.
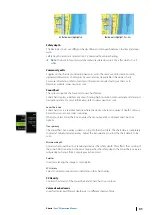
Start line
Select this option to specify if the start line, its laylines, and neutral lines appear on the chart,
and if/when to hide start line after start.
PredictWind Settings
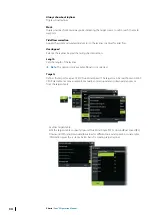
Used to enter your PredictWind credentials and specify how to download weather files. The
credentials are also used when downloading routes from the PredictWind web site.
For more information about PredictWind weather, refer to
more information about PredictWind routing, refer to
"PredictWind weather routing and departure
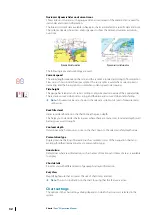
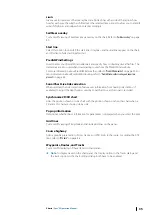
SonarChart Live tide correction
When selected, the tide correction feature uses information from nearby tide stations (if
available) to adjust the depth values used by SonarChart Live as the sonar is recorded.
Synchronize 2D/3D chart
Links the position shown on one chart with the position shown on the other chart when a
2D and a 3D chart are shown side by side.
Pop-up information
Determines whether basic information for panel items is displayed when you select the item.
Grid lines
Turns on/off viewing of longitude and latitude grid lines on the panel.
Course highway
Adds a graphic presentation of cross track error (XTE) limits to the route. For setting the XTE
limit, refer to
"XTE limit"
on page 46.
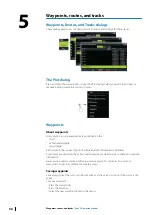
Waypoints, Routes, and Tracks
Turns on/off displaying of these items on chart panels.
Ú
Note:
To display tracks on the chart panel, the Display option in the Tracks dialog and
the tracks option in the chart settings dialog both have to be enabled.
Charts
| Zeus³S Operation Manual
35
Summary of Contents for Zeus3S
Page 1: ...ENGLISH Zeus3 S Operator Manual www bandg com...
Page 2: ......
Page 139: ......
Page 140: ...988 12586 001...

