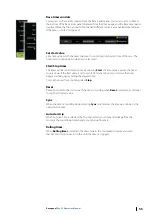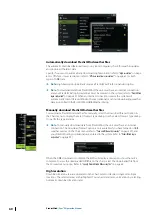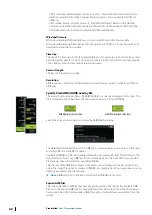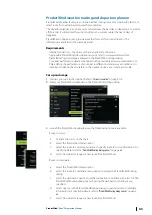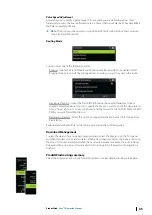
B
TWD trend*
C
Time range
D
True Wind Speed (TWS) average*
E
TWD plot
F
TWS plot
G
TWS trend*
H
Tack bar*
* Optional items. Optional items can be turned on/off individually from the Wind Plot panel
menu.
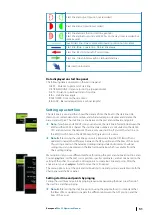
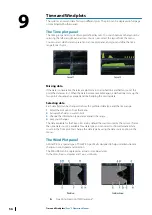
Tack bar
The tack bar shows which tack you are currently sailing on (A) and a point of sail/pre-start
status bar (B) corresponding to the data recorded at the time. Tack bar data uses the same
time scale as the main Wind Plot window.
Select the tack bar to view the tack bar legend.
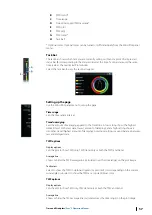
Setting up the page
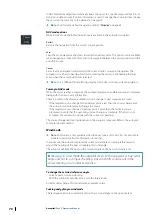
Use the Wind Plot panel menu to set up the page.
Time range
Sets the time range interval.
Trend averaging
Sets the amount of averaging applied to the Trend line. A low setting shows the highest
detail (closest to the raw data, lowest amount of damping), and a high setting shows a
smoother trend (highest amount of damping). A medium setting is a good balance between
raw and damped data.
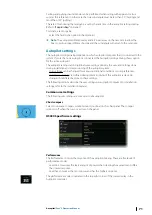
TWD options
Display options
Sets the plot to show TWD only, TWD trend only or both the TWD and trend.
Average line
Shows or hides the TWD average line (calculated over the time range) on the plot image.
Tack colors
Select to show the TWD in starboard (green) or port (red) colors depending on the current
wind angle or unselect to show the TWD as a constant (blue) color.
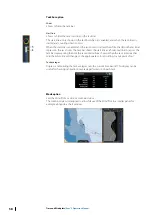
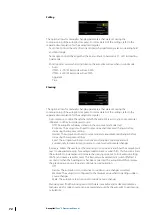
TWS options
Display options
Sets the plot to show TWS only, TWS trend only or both the TWS and trend.
Average line
Shows or hides the TWS average line (calculated over the time range) on the plot image.
Time and Wind plots
| Zeus³S Operation Manual
57
Summary of Contents for Zeus3S
Page 1: ...ENGLISH Zeus3 S Operator Manual www bandg com...
Page 2: ......
Page 139: ......
Page 140: ...988 12586 001...


