X20 system modules • Other functions • X20CM4810
2096
X20 system User's Manual 3.10
To make the actual result, or shock sequence, clearly visible, it is obviously not enough to simply provide the
amplitude spectrum. It is much more important that the process of convolution that took place when the signal
occurred be appropriately reversed so as to separate the excitation function from the natural frequency. This is
what envelope analysis provides.
An amplitude-modulated signal is made up of a high-frequency carrier signal in a low-frequency wanted signal.
The amplitude of the carrier signal changes depending on the wanted signal. In the receiver, the wanted signal is
extracted from the carrier signal by the formation of the envelope curve (demodulation).
In the case of machine resonances caused by periodic impacts, the machine resonances can be viewed as the
carrier signal and the low-pass-filtered shock pulses can be viewed as the low-frequency modulation signal. De-
modulation results in the shock pulses being extracted from the resonance frequencies.
Envelope analysis
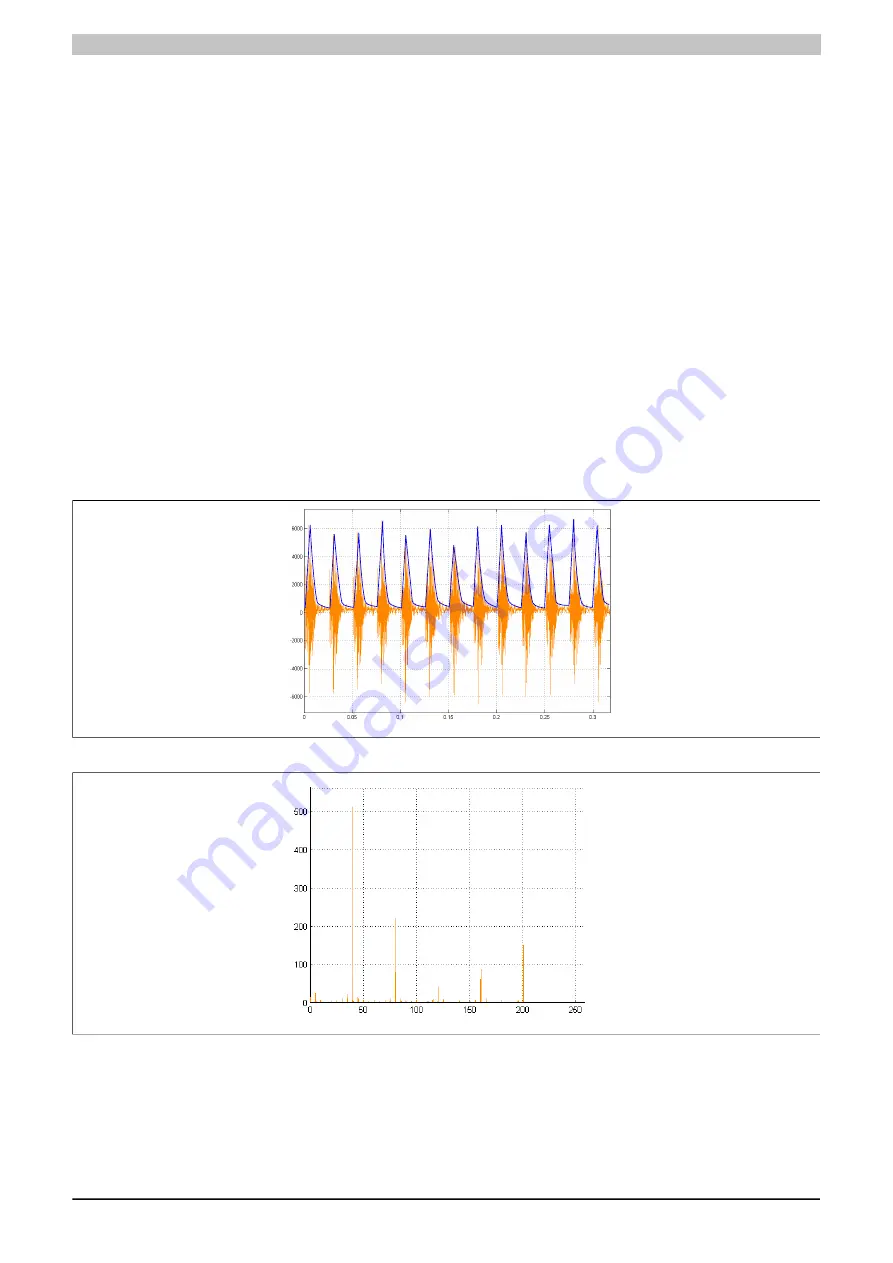
Normally in an envelope analysis, the frequency spectrum of the envelope signal is evaluated. The frequency
spectrum of the low-pass-filtered, aligned, amplitude-modulated sinusoidal oscillation is trivial since it relates to
only one sinusoidal oscillation. Suppressing the steady component gives a frequency spectrum that exhibits only
one increased amplitude at the frequency of the low-frequency sinusoidal oscillation.
The envelope signal of the periodically peaked excited machine resonance shows mostly increased amplitudes in
the shock pulse repetition rate and its multiples.
The envelope analysis is therefore a method for differentiating between harmonic causes (imbalance, orientation)
and impact-related causes (roller bearing damage, gearing damage, etc.).
Conversely, it must be stated that harmonic causes in an envelope spectrum cannot be determined accordingly.
Am
pl
itu
de
[
m
g]
Time [s]
Figure 666: Time signal with envelope
Am
pl
itu
de
[
m
g]
Frequency [Hz]
Figure 667: Resulting frequency spectrum
Summary of Contents for X20 System
Page 2: ......


