22 Barracuda Control Server Administrator’s Guide
Barracuda Control Server Administration
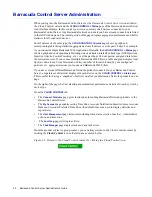
When you log into the Barracuda Control Server as the
Barracuda Control Server Account Admin
,
the Cloud Control
context
and the
CLOUD CONTROL > Status
page of the Barracuda Control Server
web interface displays. In this context you view a summary of all devices connected to your
Barracuda Control Server. Any Barracuda Networks products you have already connected are listed
in the left Products pane. The central portion of the page displays aggregated performance and traffic
statistics for all connected devices.
For all devices of the same type, the
CLOUD CONTROL > Status
page shows a graph and
corresponding table listing statistics aggregated across all devices over the past 30 days. For example,
if you connect multiple Barracuda Web Application Firewalls, the
CLOUD CONTROL > Status
page
shows a graph and corresponding table listing detected attacks, totaled by attack type (XSS Injections,
Injection Attacks, Cookie Poisoning, etc.), over the past hour, 24 hour period, and grand total since
the last system reset. If you connect multiple Barracuda Web Filters, a table and graph display total
Spyware downloads, Virus Downloads, Policy (number of threats blocked by your configured
policies), etc. aggregated across your connected Barracuda Web Filters.
If you have various different Barracuda Networks products connected to your Barracuda Control
Server, a separate set of statistics displays for each device on the
CLOUD CONTROL > Status
page.
This is useful for having a ‘snapshot’ of activity on all of your Barracuda Networks products on one
page.
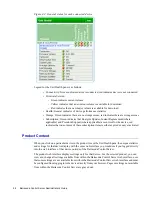
On the right of the page the Unit Health pane summarizes performance statistics for each system by
device type.
From the
CLOUD CONTROL
tab:
•
The
Connect Products
page gives instructions for adding Barracuda Networks products to the
Barracuda Control Server.
•
The
My Account
page enables setting Time Zone, Account Notification Email Address, Account
Name and Account Preferred Time Zone (the default time zone used to display statistics and
report data).
•
The
User Management
page lists users including roles, status (Active, Inactive), Administrator
actions, and time zone.
•
The
Audit Log
page lists login activity.
•
The
Task Manager
page displays tasks and any task errors.
From the product context or group context, you can always return to the Cloud Control context by
clicking the
Cloud Control
icon in the left pane as shown below.
Figure 4.1: Return to the Cloud Control context by clicking the Cloud Control icon.
Summary of Contents for Control Server
Page 1: ...Version 3 x...
Page 10: ...10 Barracuda Control Server Administrator s Guide...
Page 20: ...20 Barracuda Control Server Administrator s Guide...
Page 30: ...30 Barracuda Control Server Administrator s Guide...
Page 34: ...34 Barracuda Control Server Administrator s Guide...
Page 47: ...Limited Warranty and License 47...
Page 48: ......
Page 49: ...RECLAIM YOUR NETWORK Barracuda Networks Technical Documentation...


