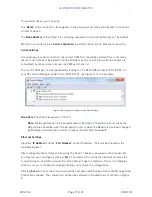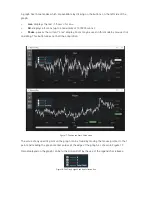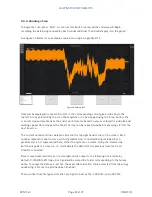
A graph has three modes which are available by clicking on the buttons on the left side of the
graph:
•
Live
: displays the last ~15 secs of scans.
•
All
: displays all scans (up to a maximum of 1000000 scans).
•
Pause
: pauses the current “Live” display, Zoom may be used in this mode by mouse click
and drag. This button does not halt the acquisition.
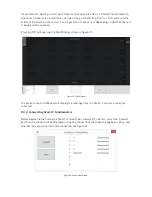
Figure 17: The Live and Pause Graph views
The value of any specific point on the graph can be found by moving the mouse pointer to that
point and reading the green marker values at the edge of the graph, as shown in Figure 17.
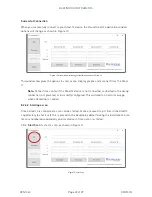
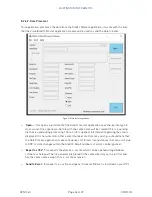
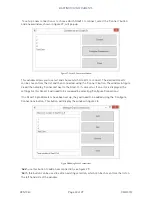
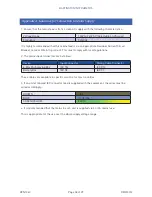
Data displayed on the graph can be turned on and off by the use of the legend check boxes:
Figure 18: The Graph Legend and Axis Selection box


