5-8
BE1-67N Testing
9190700990 Rev F
10. Rotate the Directional, Instantaneous Overcurrent control fully clockwise.
V
O
Directional Verification
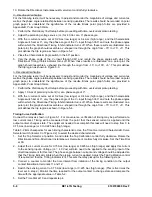
For the following tests, it will be necessary to adjust and monitor the magnitude of voltage and current as
well as the phase angle relationship between sensing quantities. The results should be recorded on polar
graph paper to understand the significance of the results. Blank polar graph forms are provided in
Appendix B,
Polar Graph Forms
.
1. Perform
the
Preliminary Test Setup
before proceeding with time overcurrent pickup testing.
2. Adjust the polarizing voltage source (V
O
) for 4.0 Vac at a 0
°
phase angle.
3. With the I
O
current source set at 0.2 Aac (low range) or 0.4 Aac (high range), and the Characteristic
Angle switch set at 0
°
, vary the phase angle of the V
O
input through 360
°
and note the phase angles
within which the Directional Timing Inhibit indicator turns off. When these results are illustrated on a
polar plot, the graph should resemble a v-shaped line through the origin from –75
°
to +75
°
,
±
5
°
. This
plot defines the trip region as shown in Figure 5-2.
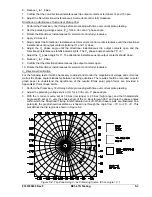
4. Place the Characteristic Angle switch in the 60
°
position.
5. Vary the phase angle of the V
O
input through 360
°
and record the phase angles with which the
Directional Timing Inhibit indicator turns off. When these results are illustrated on a polar plot, the
graph should resemble a v-shaped line through the origin from –15
°
to +135
°
,
±
5
°
. This plot defines
the trip region as shown in Figure 5-3.
I
O
Directional Verification
For the following tests, it will be necessary to adjust and monitor the magnitude of voltage and current as
well as the phase angle relationship between sensing quantities. The results should be recorded on polar
graph paper to understand the significance of the results. Blank polar graph forms are provided in
Appendix B,
Polar Graph Forms
.
1. Perform
the
Preliminary Test Setup
before proceeding with time overcurrent pickup testing.
2. Apply 1.0 Aac of polarizing current (I
O
) at a phase angle of 0
°
.
3. With the I
O
current source set at 0.2 Aac (low range) or 0.4 Aac (high range), and the Characteristic
Angle switch set at 0
°
, vary the phase angle of the V
O
input through 360
°
and note the phase angles
within which the Directional Timing Inhibit indicator turns off. When these results are illustrated on a
polar plot, the graph should resemble a v-shaped line through the origin from –75
°
to +75
°
,
±
5
°
. This
plot defines the trip region as shown in Figure 5-4.
Timing Curve Verification
Connect the relay as shown in Figure 5-1. For convenience, verification of timing may be performed at a
low current level. Timing will be measured from the point that the sensed current is applied until the
output contact changes state. The equipment needed to accomplish this task will need to step from 0 to
0.75 Aac (low range) or 0 to 0.225 Aac (high range).
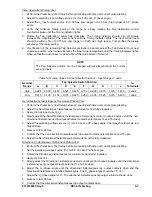
Table 5-2 lists checkpoints for each timing characteristic. Use the Time Overcurrent Characteristic Curve
Selector switch (locator C of Figure 2-2) to select the desired characteristic.
1. Set the Tap Selector at position A and rotate the Tap Calibration control fully clockwise. Rotate the
Directional and Non-Directional Instantaneous Overcurrent controls fully clockwise. Set the Time Dial
at 00.
2. Adjust the I
O
current source for 0.75 Aac (low range) or 0.225 Aac (high range) and apply this current
to the sensing inputs. Voltage (V
O
= 4.0 Vac) will also need to be applied to the sensing input of the
directional element for this test. The phase angle between current and voltage should be adjusted so
that the Timing indicator lights when the pickup current is applied. Adjust the Tap Calibration control
(if required) so that the Timing indicator is lit. This sets the relay pickup for the following steps.
3. Connect a counter to monitor the time interval from initiation of the timing condition to the output
contact transition at terminals 11 and 12.
4. Switch the sensing current to 0.75 Aac (low range) or 0.225 Aac (high range). (This is five times the
level set in step 2.) Monitor the time required for the output contact to change state and compare the
time with the appropriate value in Table 5-2.
5. Set the Time Dial at 10 and repeat step 4.
Summary of Contents for BE1-67N
Page 2: ......
Page 6: ...iv BE1 67N Introduction 9190700990 Rev F This page intentionally left blank...
Page 8: ...vi BE1 67N Introduction 9190700990 Rev F This page intentionally left blank...
Page 10: ...ii BE1 67N General Information 9190700990 Rev F This page intentionally left blank...
Page 18: ...1 8 BE1 67N General Information 9190700990 Rev F This page intentionally left blank...
Page 20: ...ii BE1 67N Controls and Indicators 9190700990 Rev F This page intentionally left blank...
Page 26: ...ii BE1 67N Functional Description 9190700990 Rev F This page intentionally left blank...
Page 34: ...ii BE1 67N Installation 9190700990 Rev F This page intentionally left blank...
Page 39: ...9190700990 Rev F BE1 67N Installation 4 5 Figure 4 4 Case Dimensions Rear View...
Page 43: ...9190700990 Rev F BE1 67N Installation 4 9 Figure 4 7 Typical Internal Connections...
Page 46: ...4 12 BE1 67N Installation 9190700990 Rev F This page intentionally left blank...
Page 48: ...ii BE1 67N Testing 9190700990 Rev F This page intentionally left blank...
Page 58: ...ii BE1 67N Characteristic Curves 9190700990 Rev F This page intentionally left blank...
Page 72: ...A 14 BE1 67N Characteristic Curves 9190700990 Rev F This page intentionally left blank...
Page 74: ...B 2 BE1 67N Polar Graph Forms 9190700990 Rev F This page intentionally left blank...

