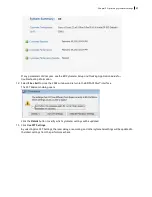
15. Print the experiment-level cytometer settings by right-clicking the
Cytometer Settings
icon in the
Browser
and selecting
.
16. Install a tube with less than 1 mL of DI water onto the SIP.
17. Place the cytometer in standby mode.
Analyzing data
Introduction
This topic describes how to analyze recorded tubes by creating plots, gates, a population hierarchy, and
statistics views on a new global worksheet.
Analyzing data
To analyze data:
1. Use the
Browser
toolbar to create a new global worksheet. Rename it
MyDataAnalysis
.
2. Create the following plots on the
MyDataAnalysis
worksheet:
l
FSC vs SSC
l
FITC vs PE
l
FITC vs PerCP-Cy5.5
l
FITC vs APC
3. Create a population hierarchy and a statistics view, and set them below the plots on the worksheet.
l
Right-click any plot and select
Show Population Hierarchy.
l
Right-click any plot and select
Create Statistics View.
4. Set the current tube pointer to
Beads_001
.
5. Draw a gate around the singlets on the FSC vs SSC plot.
6. Use the population hierarchy to rename the population
Singlets
.
7. Select all plots except the FSC vs SSC plot, and use the
Plot
tab in the
Inspector
to specify to show only the
singlet population.
Chapter 6 Recording and analyzing data
71
Summary of Contents for FACSymphony A1 Flow
Page 1: ...FACSymphony A1 Flow Cytometer User s Guide 23 23437 01 2022 07 For Research Use Only ...
Page 6: ......
Page 10: ...This page intentionally left blank ...
Page 24: ...This page intentionally left blank ...
Page 36: ...This page intentionally left blank ...
Page 50: ...This page intentionally left blank ...
Page 87: ...More information l Running a performance check page 55 Chapter 7 Technical overview 87 ...
Page 88: ...This page intentionally left blank ...
Page 96: ...This page intentionally left blank ...


