l
In the FITC vs PE plot, draw a gate around the FITC-positive population. Name the population
FITC
positive
in the population hierarchy.
l
In the FITC vs PE plot, draw a gate around the PE-positive population. Name the population
PE positive
in
the population hierarchy.
l
In the FITC vs PerCP-Cy5.5 plot, draw a gate around the PerCP-Cy5.5-positive population. Name the
population
PerCP-Cy5.5 positive
in the population hierarchy.
l
In the FITC vs APC plot, draw a gate around the APC-positive population. Name the population
APC
positive
in the population hierarchy.
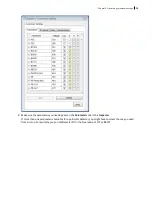
11. Format the statistics view.
a. Right-click the statistics view and select
Edit Statistics View.
b. Click the
Header
tab and select the
Specimen Name
and
Tube Name
checkboxes.
c. Click the
Populations
tab and select all populations except
All Events.
Clear the
%Parent
,
%Total
, and
#Events
checkboxes.
d. Click the
Statistics
tab and select the mean for each of the fluorescence parameters.
e. Click
OK
.
12. Print the analysis.
Chapter 6 Recording and analyzing data
73
Summary of Contents for FACSymphony A1 Flow
Page 1: ...FACSymphony A1 Flow Cytometer User s Guide 23 23437 01 2022 07 For Research Use Only ...
Page 6: ......
Page 10: ...This page intentionally left blank ...
Page 24: ...This page intentionally left blank ...
Page 36: ...This page intentionally left blank ...
Page 50: ...This page intentionally left blank ...
Page 87: ...More information l Running a performance check page 55 Chapter 7 Technical overview 87 ...
Page 88: ...This page intentionally left blank ...
Page 96: ...This page intentionally left blank ...


