57
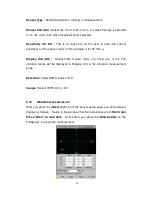
results on a waterfall plot. For example, the plot below is the envelope scanning
result of a damaged bearing.
From this example you can see that the envelope spectrum shows clear bearing
signal when the envelope filter is set at 3.2 kHz and 12.7 kHz. Hence you can set
the center of envelope filter at one of these frequencies for a better measurement
quality.
4.21 Tools
The first 3 options of Tools menu have been discussed in the previous
paragraph. Please reference to Section 4.16. The other two options are used to
acquire a trace (horizontal) or a slice (vertical) for display in the trace plot.
Add To Trace Plot :
Select this option to acquire a data trace or slice, which is highlighted by the
cursor, for display in the trace plot. You can add up to 8 traces at most.
Note: You can press OK key for quick access to this function.
Clear Trace Plots :
Select this option to clear all the traces in the trace plot.


