P
ag
e
45
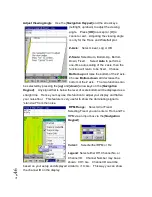
Trace and Waterfall display
Trace and Intensity Map display
Trace Only
:
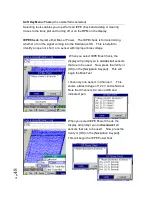
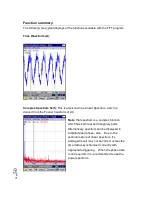
Selecting Trace only allows the user to post traces from the waterfall map on the
display and then review the values in a Power Spectrum display as shown below.
The Trace only also allows the user to mark cursors, and also perform a TTL out if
desired on the Tools menu. Note that we are in the waterfall section, because
you can go back to trace/ waterfall or trace / map.
Summary of Contents for Fieldpaq
Page 5: ...Page 4 ...
Page 54: ...Page 53 Orbit x y ...
Page 61: ...Page 60 ...
Page 104: ...Page 103 Power Spectrum Time Waveform Bearing Spectrum ...
Page 199: ...Page 198 ...
Page 200: ...Page 199 DVF specifications Maximum frequency band Maximum resolution Maximum file size ...
Page 204: ...Page 203 Done ...
Page 206: ...Page 205 5 Start the Data Explorer Program 6 Select File Import ...
Page 215: ...Page 214 ...
Page 222: ...6 ...


